What Are Activity and Efficiency Metrics?
Analysts view Activity Metrics as measures of a company's ability to Improve financial performance and financial position.
Activity and efficiency metrics measure a company's ability to use its resources efficiently. Analysts view these metrics as measures of management effectiveness.
Define Activity and Efficiency Metrics
Activity and Efficiency Metrics are measures of a company's ability to…
- Use its resources to operate and earn income efficiently.
Owners and investors expect the firm's assets and human resources to earn profits and deliver other returns at acceptable cost. - Keep its resources earning actively.
These metrics assess the firm's capability to reach this goal by measuring rates for cycles such as inventory turns, creditor payoffs, accounts receivable, and average collection period.
Many companies define and measure essential business objectives in terms of activity and efficiency metrics.
- They may launch initiatives specifically to improve inventory turns, for instance, by managing stock more carefully, or adopting "just in time" sourcing.
- They may try to strengthen asset turnover by selling off expensive assets such as buildings or land.
Analysts will look primarily for trends or changes in these metrics from year to year as indicators of the company's ability to improve financial performance and financial position. They will also see these metrics as indicators of specific problems that need management attention.


Explaining Activity Metrics in Context
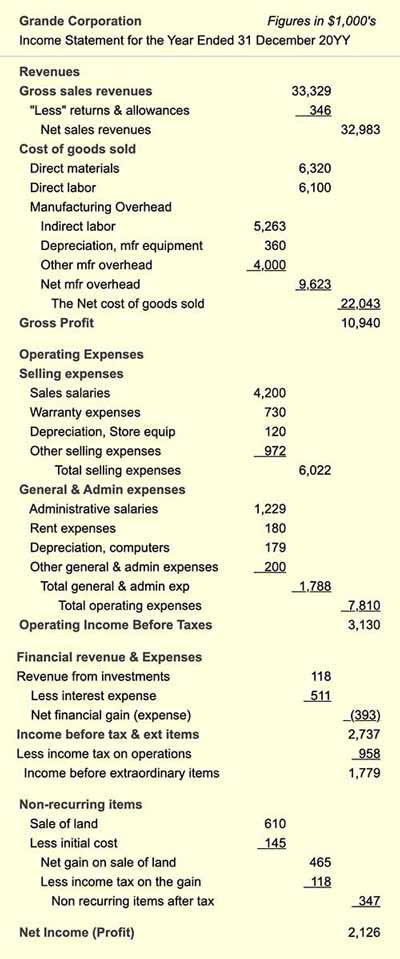
Sections below define and illustrate eight favorite activity metrics. Individual metrics appear in context with related concepts and the business questions each metric addresses. Example calculations use data from the sample Income statement and Balance sheet, also included below. This article covers the following activity and efficiency metrics
- Sales Revenue per Employee.
- Inventory Turns.
- Days Sales in Inventory (Average Turnover Period, Days Inventory Outstanding)
- Days Payable Outstanding
- Accounts Receivable Turnover
- Average Collection Period (Days Sales Outstanding)
- Total Asset Turnover
- Fixed Asset Turnover
Contents
- What are activity and efficiency metrics?
- The role of activity-efficiency metrics and other financial statement metrics (business ratios) in business.
- What are the most popular activity and efficiency metrics? Define, calculate, and explain eight commonly used measures.
- "Sales revenue per employee"
- "Inventory turns"
- "Days sales in inventory," "Average turnover period," "Days inventory outstanding DIO"
- "Days payable outstanding (DPO)"
- "Accounts receivable turnover"
- "Average collection period," "Days sales outstanding (DSO)"
- "Total asset turnover"
- "Fixed asset turnover"
- Example Income statement with "activity-efficiency metrics" input data.
- Example Balance sheet with "activity-efficiency metrics" input data.
Related Topics
- For an introduction to financial metrics in business, see Financial Metrics. The article covers both cash flow metrics and financial statement metrics (ratios).
- For complete coverage of financial metrics, with in-depth examples and a working set of interrelated financial statements, see the Excel-based ebook Financial Metrics Pro.
What is the Role of Activity Efficiency Metrics (Business Ratios)?
Activity and Efficiency metrics are one of six financial metrics families that analysts call financial statement metrics. In general, these metrics use data from the firm's financial statements to measure the company's financial performance for a specific time span, or the strength of its financial position at one point in time. Financial statement metrics derive primarily from figures from the four primary financial accounting statements in Exhibit 1:
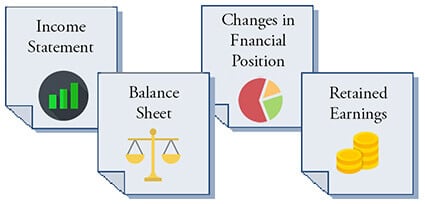
Note that some businesspeople refer to all financial statement metrics as "business ratios" or simply "ratios." Almost all represent ratios made of two or more financial statement figures. Note, however, that a few of these metrics are not ratios. The "Working capital" metric, for instance, is the difference between two Balance sheet figures, not a ratio.
Who Uses Financial Statement Metrics? For What Purpose?
Financial statement metrics are generally useful:
- Investors considering buying or selling stock or bonds in a company.
- Company officers and senior managers, for identifying strengths, weaknesses, and target levels for business objectives.
- Shareholders and boards of directors, for evaluating management performance.
What are the Six Families of Financial Statement Metrics?
Each of the six financial statement metrics families addresses a different kind of question about the company. The families and the types of questions each address are the following.
- Activity and efficiency metrics (the subject of this article).
Activity metrics ask: Does the company use resources efficiently? - Liquidity metrics.
Liquidity metrics ask: Can the firm meet immediate spending needs? - Profitability metrics.
Profitability metrics ask: is the firm earning acceptable margins? - Leverage metrics.
Leverage metrics ask: How do owners and creditors share risks and rewards? - Valuation metrics.
Valuation metrics ask: What are the firm's prospects for future earnings? - Growth metrics.
Growth metrics ask: Are revenues, profits, and market share growing?
Sections below define, explain, and calculate activity and efficiency metrics. Links above for other families lead to similar coverage for other "metrics families," including, "Liquidity," "Profitability," "Leverage," "Valuation," and "Growth" metrics.
Frequently Used Activity Efficiency Metrics
Some Call These Metrics "Business Ratios"
The sections below present eight of the most popular activity and efficiency metrics used in business today. The sections explain the essential meaning of each metric, present example calculations, and discuss "rules of thumb" for interpreting metrics results.
Find input data for Activity and Efficiency Metrics in two financial reports:
Note that input data for example Activity and Efficiency metrics below come from the sample Balance sheet and Income statement lower on the page.
Activity-Efficiency Metric 1
Sales Revenues Per Employee
The Meaning of the "Sales Revenues Per Employee" Metric
Sales revenues per employee is a simple but informative measure of the company's ability to generate sales revenues with its employee population. Company publicity may claim that "employees are our most important assets," but employee value does not appear within the structure of the Balance sheet. While the Balance sheet itself does not measure employee value this way, this metric, Sales revenue per employee, does provide a rough measure.
How is Sales Revenue per Employee Calculated?
This example uses the following data;
Net sales revenues for the year (from the Income statement): $32,983,000
Average number of employees for the year: 320
Sales Revenue per Employee
= Net sales revenues / Average number of
employees
= $32,983,000 / 320
= $103,072
For companies that are either expanding or engaging in significant layoffs, the employee count at year-end may be quite different from its average value during the year. Companies that engage in seasonal hiring and layoffs may also have an average employee count different from the year-end figure. Where employee numbers change significantly during the year, the average employee count for the year is a better measure of efficiency than the year-end figure. Companies with highly seasonal "sales" and "employee headcount" should closely monitor "Sales revenue per employee" on a quarterly or monthly basis as well as an annual basis.
Sales Revenues per Employee Rules of Thumb
- Sales revenues per employee must exceed the company's cost per employee if the company is to be profitable.
- Year-to-year changes in sales revenues per employee should at least keep pace with inflation and rising costs.
Activity-Efficiency Metric 2
Inventory Turns
Inventories, like other assets, should work continuously producing returns—that is, bringing in cash. Inventories that sit idle for long time periods are not working efficiently and may not be justifying their presence on the Balance sheet. Assets such as construction equipment should be in use constantly on construction projects, producing incoming revenues. Similarly, inventory assets "work" by getting off the shelves and turning into sales revenues.
The inventory "turns" count per year is a rough measure of inventory liquidity, that is, how quickly inventory turns into cash. Stock items that do not turn into cash quickly are nonproductive assets.
This metric measure Inventory turns by comparing "total net sales" from the Income statement to the value of "inventory" from the Balance sheet. The Balance sheet inventory figures, of course, represent inventories at period-end. When used this way, the "period-end inventory total" is serving as a stand-in for the typical or average inventory total for the year, at least to create the Inventory turns metric.
How is Inventory Turns Calculated?
The Inventory turns example uses these data from the sample financial statements below:
Net sales revenues (from the Income statement): $32,983,000
Cost of goods sold (from the Income statement): $22,043,000
Total inventories at period end (from the Balance sheet): $5,986,000
Note that Balance sheet inventory figures may include several asset sub-categories, such as raw materials, work in progress, finished goods inventories, office supplies, and others.
Inventory turns (Method 1 using Net Sales)
= Net sales revenues/Total inventories
= $32,983,000 / $5,986,000
= 5.5 turns/year
Note that the Inventory turns metric is sometimes computed using Cost of goods sold (CGS), or Cost of sales in place of Net sales revenues. Whereas "Net sales revenues" represents the market value of goods, cost of sales or CGS for the period represents their actual cost to the company:
Inventory turns (Method 2 using CGS)
= Cost of goods sold / Total inventories
= $22,043,000 / $5,986,000
= 3.7 turns/year
The second method using CGS will generally be lower or more conservative than Method 1 using Net Sales.
Note also, that "Average inventory value" is sometimes used in place of "Total Inventories." The latter represents the end of period Balance sheet figure. When there are substantial seasonal fluctuations in inventories, however, some analysts view the period average inventory value as the more appropriate representation.
Inventory Turns Rules of Thumb
Generally speaking, management usually prefers higher turn rates over lower rates for several reasons:
- "Inventory" represents an investment by the company. While the investment sits in inventory, funds used for its purchase cannot serve other purposes.
- Inventory may require expensive storage space and handling.
- Some kinds of inventory lose value quickly: Food, plant, and animal products may be subject to spoilage. Technology products may become outdated and obsolete. Fashion products hold their value only for a short season. Maintaining a high inventory turn rate for products with short "shelf life" is critical.
On the other hand, inventory turn rates are too high if lack of inventories interferes with the company's ability to maintain manufacturing or production schedules, provide warranty service, expand into new markets, or otherwise meet customer needs.
- In most cases, therefore, the optimal inventory levels and optimal inventory turn rates represent a tradeoff between inventory costs, on the one hand, and the negative business impact of insufficient inventory on the other.
- The difference between "good" and "poor" inventory turn metrics varies widely from industry to industry, and even between good companies in the same industry.
- An inventory turn rate that is substantially below industry average may signal a severe problem in production or sales. For a specific company, analysts compare inventory turns from year to year, to track changes in efficiency.
Activity-Efficiency Metric 3
Days Sales In Inventory
The Meaning of the "Days Sales in Inventory" Metric
The "Days sales in inventory" (or "Average turnover period," or "Days inventory outstanding," DIO) metric carries the same information as the inventory turns metric (above). Whereas "Inventory turns" is a rate, or frequency per period, the "Days sales in inventory" metric express the same information as regarding the number of days per inventory turn.
Calculating "Days Sales in Inventory"
The "Days sales in inventory" examples here use the following data:
Inventory turns per year (based on Net sales revenues): 5.5
Inventory turns per year (based on Cost of goods sold): 3.7
Days per year: 365 (some analysts prefer 360)
The "Days sales in inventory" metric calculates by dividing the number of inventory turns per year into the number of days per year. For the same example data used above:
Days sales in inventory, or Average turnover period
(Method 1, using Inventory turns based on Net sales revenues)
= Days per year / Inventory turns per year
= 365 / 5.5
= 66.4 days
Note, however, that there are two commonly used approaches to calculating inventory turns per year (as the section above shows). One inventory turn metric represents "Net sales revenues" divided by "Total inventories," but the other uses "Cost of goods sold" divided by "Total inventories" (or "Average inventory"). When using the latter approach to "Inventory turns," the "Days sales in inventory" metric is more likely to be called "Days inventory outstanding," or DIO.
Days inventory outstanding (DIO), or Days sales in inventory, Average turnover period
(Method 2, using Inventory turns based on Cost of goods sold)
= Days per year / Inventory turns per year
= 365 / 3.7
= 98.7 days
DIO, calculated this way is one of the three components of the liquidity metric, Cash conversion cycle (CCC), illustrated in the Liquidity metrics pages. The two other CCC components are other efficiency metrics, Days sales outstanding (DSO) and Days payable outstanding (DPO).
Days Sales in Inventory Rules of Thumb
Since this metric carries the same information as the Inventory turns metric (above), see the rules of thumb and guidelines for Inventory turns, above. A minor note of caution when comparing days sales in inventory metrics: Be sure that all values for comparison are using the same number of days per year. This measure sometimes applies a 365-day year and sometimes a 360-day year.
Activity-Efficiency Metric 4
Days Payable Outstanding DPO
Days payable outstanding (DPO) is a measure of how long, on average, a company takes to pay its creditors.
Calculating "Days Payable Outstanding" (DPO)
The DPO examples in this section use the following Income statement and Balance sheet data (from the sample statements below):
Accounts payable (from the Balance sheet): $1,642,000
Cost of Goods sold (from Income statement): $22,043,000
Number of days per year: 365 (some analysts prefer 360)
Days payable outstanding (DPO)
= (Accounts Payable / Cost of goods sold) * Days per
year
= ($1,642,000 / $22,043,000) *365
= 27.2 days
DPO, calculated this way is one of the three components of the liquidity metric, Cash conversion cycle (CCC), illustrated in the liquidity metrics pages. The two other CCC components are other efficiency metrics, Days sales outstanding (DSO) and Days inventory outstanding (DIO).
"Days Payable Outstanding" Rules of Thumb
- The "Days payable outstanding" (DPO) metric does not measure how quickly a company can pay its bills (liquidity metrics, such as the quick ratio measure that). DPO shows how quickly the company does pay its bills. Good financial leadership will generally try to avoid paying as long as creditors allow, to use the funds for earning interest or otherwise working for company gain.
- "Days payable outstanding" should reflect the weighted average credit terms granted the company by its suppliers. The company in the example above, for instance, has a DPO of 27.2 days, suggesting that most of its creditors ask for "net 30 days" payment (a few may ask for "net 15" or immediate payment, bringing the average down a little below 30 days).
- A trend over time towards shorter DPS could indicate the company is getting increasingly poor credit terms from its suppliers.
Activity–Efficiency Metric 5
Accounts Receivable Turnover
The Meaning of "Accounts Receivable Turnover" Metric
The "Accounts receivable turnover" metric (this section) and "Average collection period" (next section) measure the rate at which accounts receivable turnover." Accounts receivable" appear on the Balance sheet as assets. Like other assets, those that take longer to turn over are considered less productive than those that turn over quickly.
Calculating "Accounts Receivable Turnover"
"Accounts receivable turnover" is merely the ratio of "Net sales revenues" (an Income statement entry) over "Accounts receivable" (a Balance sheet item).
From the sample statements below, the data for the average turnover period metric are:
Net sales revenues (from the Income statement): $32,983,000
Net accounts receivable (from the Balance sheet): $1,832,000
Accounts receivable turnover
= Net sales revenues / Net accounts receivable
= $32,983,000 / $1,832,000
= 18.0 Accounts receivable turns for the year
Accounts Receivable Turns Rules of Thumb
- An "Accounts receivable turns" rate greater than 12 indicates that, on average, the company collects "Accounts receivable" in one month or less. This conclusion follows in the example company above, with an accounts receivable ratio of 18.0. If this is in accord with the company's payment terms, the company's collection performance seems healthy.
- The measures of Accounts receivable turnover and Average collection period (next section) reflect the company's ability to enforce sound credit and collection policies. "Normal" or stated collection periods for receivables vary from industry to industry, ranging from 10 to 45 days. When the receivables turnover or average collection period exceeds the company's stated payment policy, this may be a sign that the company is having to accept business from customers who are poor credit risks.
- Long collection periods (or low accounts receivable turnover) may also mean the company is having to negotiate extraordinarily long payment terms to win business.
Activity-Efficiency Metric 6
Average Collection Period
The Meaning of the "Average Collection Period" Metric
The "Average collection period" (or "Days Sales Outstanding," DSO) metric in this section and the accounts receivable turnover metric (above) both measure the rate at which "accounts receivable" turnover. Accounts receivable appear on the Balance sheet as assets, but those that take longer to turn over are considered less productive assets than those that turn over quickly.
Calculating the Average Collection Period
Average collection calculation begins by finding net sales revenues per day. Using the net sales revenues figure from the sample Income statement below ($32,983,000), and a 365 day year,
Net sales revenue per day
= Net sales revenues for the year / Days per year
= $32,983,000 / 365
= $90,364 sales revenues per day
The average collection period is then found by dividing net accounts receivable by the sales revenues per day. Using the net accounts receivable figure from the sample Balance sheet below ($1,832,000),
Average collection period
= Net accounts receivable / Net sales revenues per day
= $1,832,000 / $90,364
= 20.3 days
You may notice that the average collection period here (20.3 days), multiplied by the accounts receivable turnover period (18 times/year) results in 365. The average collection period, or days sales outstanding, thus contains the same information as the accounts receivable turnover rate.
Average collection period or Days sales outstanding (DSO) calculated this way is one of the three components of the liquidity metric, Cash conversion cycle (CCC), illustrated in the liquidity metrics pages. The two other CCC components are other efficiency metrics, Days inventories outstanding (DIO) and Days payable outstanding (DPO).
Average Collection Period (Days Sales Outstanding, DSO) Rules of Thumb
Because the average collection period carries the same information as the accounts receivable turnover metric (previous section), the two measures have nearly identical rules of thumb.
- An "Average collection period" of 30 days or less indicates that, on average, the company collects "Accounts receivable" in one month or less. If this is in accord with the company's payment terms, the company's collection performance seems healthy.
- The measures of "Accounts receivable turnover" (previous section) and "Average collection period" reflect the company's ability to enforce good credit and collection policies. "Normal" or stated collection periods for receivables vary from industry to industry, ranging from 10 to 45 days. When the receivables turnover or average collection period exceeds the company's stated payment policy, this may be a sign that the company is having to accept business from customers who poor credit risks.
- Long collection periods (or low accounts receivable turnover) may also mean the company is having to negotiate extraordinarily long payment terms to win business.
Activity-Efficiency Metric 7
Total Asset Turnover
Companies acquire assets to generate revenues. Total asset turnover (this section) and the metric in the following section, "Fixed asset turnover," both compare directly "Revenue returns" from the company's assets ("Sales revenues") to the book value (Balance sheet value) of the assets. The higher the asset turnover rate, the shorter the time required for assets to generate their worth in sales.
These metrics are considered "activity" or "efficiency" metrics and should not be confused with "profitability" metrics, such as "Return on total assets" or "Return on equity." (those appear in the article "Profitability Metrics").
Calculating "Total Asset Turnover"
The "Total asset turnover" metric is a ratio constructed as "Net sales revenues" (an Income statement item) divided by "Total assets (a Balance sheet item). From the example financial statements below:
Net sales revenues (from the Income Statement): $32,983,000
Total Assets (from the Balance sheet): $22,075,000
Total asset turnover
= Net sales revenues / Total assets
= $32,983,000 / $22,075,000
= 1.49 total asset turns / year
Total Asset Turnover Rules of Thumb
- The important information for any company in total asset turnover metrics has to do with year to year changes. Generally, total asset turnover rates should increase from year to year.
- Significant investments in assets are necessary to operate in some industries (power generation or heavy manufacturing, for instance). Running in other industries may require very few fixed assets (consulting or other professional services, for example). In still other industries, some companies choose to acquire operational assets such as buildings, computer systems, and vehicles, while other companies in the same sector utilize the same assets through operating lease or rental contracts which leaves asset ownership to another party. For these reasons, comparing total asset turnover ratios with "industry standards" or between companies should be done cautiously.
Activity–Efficiency Metric 8
Fixed Asset Turnover
The "Fixed asset turnover" metric compares sales revenue earnings ("Net sales revenues" from the Income statement) to the value of the company's total "Fixed assets" (also known as "Property, plant and equipment" or, sometimes, "Operating assets"), from the Balance sheet. It is a measure of how well the company generates revenue from assets that are not as liquid as current assets.
Calculating the "Fixed Asset Turnover" Rate
From the example financial statements below:
Net sales revenues (from Income statement): $32,983,000
Fixed Assets (Total Property, Plant & Equipment, from Balance sheet) = $9,716,000
Total Asset Turnover
= Net sales revenues / Total fixed assets
= $32,983,000 / $9,716,000
= 3.4 total fixed asset turns / year
For any company, fixed asset turnover will of course always be higher than total asset turnover.
"Fixed Asset Turnover" Rules of Thumb
"Fixed asset turnover" rules of thumb are very similar to "Total asset turnover" rules of thumb (previous section).
- The vital information for any company in "Fixed asset turnover" metrics has to do with year-to-year changes. Generally, fixed asset turnover rates should increase from year to year.
- Substantial investments in fixed assets are necessary to operate in some industries (power generation or heavy manufacturing, for instance). Working in other sectors may require very few fixed assets (consulting or other professional services, for example). In still other industries, some companies choose to acquire operational assets such as buildings, computer systems, and vehicles, while other companies in the same sector utilize the same assets through operating lease or rental contracts which leaves asset ownership to another party. For these reasons, comparing fixed asset turnover ratios with "industry standards" or between companies should be done cautiously.
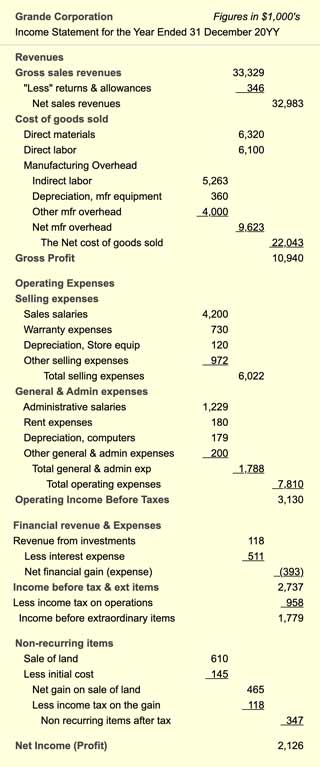
Example Detailed Income Statement
Including Activity-Efficiency Metrics Input Data
Some of the data for activity and efficiency metrics appear in the example Income statement in Exhibit 2 below.
Example Detailed Balance Sheet
Including Activity-Efficiency Metrics Input Data
The example Balance sheet in Exhibit 3 below provides data for some of the activity and efficiency metrics appearing above.


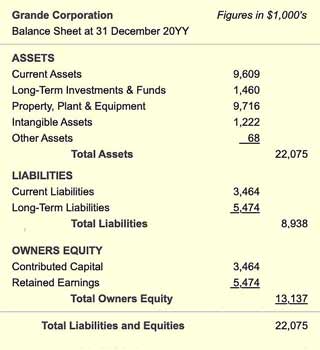
Exhibit 1. The simple example Balance Sheet above shows the basic structure and significant categories under Assets, Liabilities, and Owners Equity.
For a complete introduction to financial metrics, including a working set of interrelated financial statements and over 150 "financial metrics" derived from them, see Financial Metrics Pro.

