What Is Asset Structure?
Understanding asset structure is key to maximizing business returns from its asset base.
Assets are items of value a business entity owns or controls, which it uses to earn income. In business, the term has two meanings:
- In accounting and finance, asset refers to balance-sheet assets: items of value, that the business acquires at specific cost, on record with a book value in a balance sheet Assets account.
- In general usage, asset simply means anything that benefits the business. Some say "our employees are our most valuable assets." Restaurants claim attractive locations as assets. Such examples are assets, but not balance sheet assets.


Business analysts, accountants, and financial officers are referring to balance sheet assets when they describe core rules for assets:
Assets must earn returns to justify their place in the asset base. When costly assets sit idle, or when they earn less than they cost to use and maintain, business performance and financial position suffer. They suffer also when asset structure does not support the high-level business strategy.
Asset structure is a visible embodiment of the firm's strategy for earning from the asset base.
Define Asset Structure
Asset structure refers to the structure of the fim's asset base (all balance sheet assets). Asset structure shows the distribution of the total asset base, by proportion or percentage, across major asset categories.
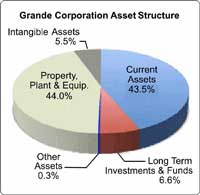
Assets Address Business Objectives
Business textbooks present the primary objective for profit-making companies as "increasing owner value." Firms achieve this objective by earning profits. And, profits, in turn, increase owner value as dividends and retained earnings. In this regard, "assets" are "what the company has to work with," or what it uses to earn profits. In other words, firms use assets to achieve business objectives.
In the DuPont Analysis System, the highest level performance metric compares a firm's profits to the size of its asset base. The metric's name, not surprisingly, is "Return on assets (ROA)." As a result, the ROA measures company performance as what the company earns working with its assets base. For more on ROA and other profitability metrics see Profitability.
The Challenge for Management
Understandably, then, a company's asset structure is central to two kinds of questions that managers and owners face throughout a company's life:
- First, how should the firm acquire assets? This question asks: How much of the asset base should they obtain through equity funding and how much through debt funding?
- Second, How does the company maximize returns on its asset base?
The first question—about funding—deals with the "Liabilities and Equities" side of the Balance sheet, leverage, and investor returns. For more on these subjects, see the article Capital structure and financial structure.
Answering the second question—about asset returns—requires an understanding of how to build and optimize the company's asset structure, the subject of this article.
Explaining Asset Structure in Context
Sections below further define and illustrate asset structure in context with asset-related terms, emphasizing two themes:
- First, the role of Balance Sheet categories in defining three structures for the firm: Asset Structure, Financial Structure, and Capital Structure.
- How companies manage asset structure to pursue strategic objectives for Return on Assets (ROA).
Contents
- What is asset structure?
- Asset structure on the Balance sheet
- Asset structure and ROA: The traditional Finance and Accounting view
- What is the strategic approach to asset structure and ROA?
Related Topics
- Assets accounts and the asset lifecycle, see Asset.
- Capital budgeting (CAPEX), see Budget.
- Prioritizing capital proposals, see Capital Review Process.
Asset Structures on the Balance Sheet
The Balance Sheet Shows Asset, Financial, and Capital Structures
Understanding asset structure begins with by understanding how the balance pictures three different organizational structures—three structures that determine how the firm uses assets, liabilities, and equities to earn revenues and profits. To understand the balance sheet, remember first that the overall structure of this sheet represents the Balance sheet equation:
Assets = Liabilities + Owners Equity
For firms that use a double-entry accounting system, incidentally, the "balance" between the left and right sides of this equation always holds. Double-entry rules ensure that any change to one of these totals (Assets, Liabilities, or Equity) brings a change in one or both of the other totals, restoring the balance. If the Assets total increases by, say, $1,000,000, then total Liabilities + Owners Equity must also increase by $1,000,000.
Exhibit 1, below, uses red, green, and blue borders to show which balance sheet categories make up each structure:
- Asset Structure (Green border).
- Financial structure (Red border).
- Capital structure, or Capitalization, (Blue border).



The analyst defines a balance sheet structure by:
- Selecting a group of balance sheet categories and designating the group a structure.
- Specifying the total value reported for all structure components.
- Calculating the percentage of total structure value in each structure component.
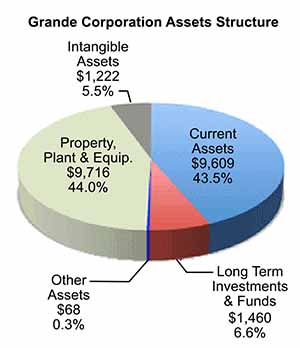
The green, red, and blue boundry lines in Exhibit 1 above each enclose the components of one balance sheet structure. The red boundary holds the five components of the firm's asset structure.
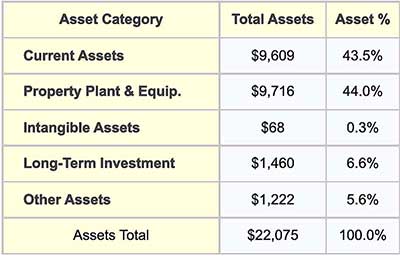
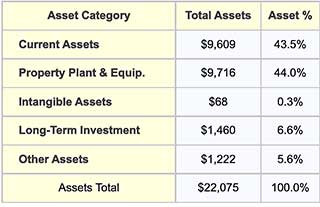
Here, 100% of Grande Corporation's Asset base has a total value of $22,075.. Analysts reveal structure in the base by showing how 100% of $22,075 is distributed among each of the five structure components. (Exhibits 2 and 3).
Asset Structure and Return on Assets ROA
The Finance and Accounting View of ROA
For fiscal year 20YY, Grande Corporation's earnings (net profits) were $2,126,000. Also, the firm earned these profits from an asset base with a Balance sheet value of $22,075,000. The company's Return on assets for FY 201X was, therefore:
ROA = Net profit / Total asset book value
= $2,126,000 / $22,075,000
= 9.6%
Managers and shareholders will immediately ask asset-related questions like these:
- Does this ROA represent "good" business performance?
- How do we sustain and improve ROA?
- Are there threats or risks that could lower ROA?
Regarding the role of the asset base in answering such questions, most firms take the traditional "Finance and Accounting view," in this section. The next major section explains a different approach, the "Strategic Approach."
For asset optimization, the "Traditional Finance and Accounting view" begins with the company's assets and their values in asset accounts. Exhibits 2 and 3, for example, show Grande Corporation's holdings in five asset categories. For more on asset categories, including some not appearing here, see Assets and Asset Lifecycle Management.
Asset Structure From the Accountant's Point of View.
Accounting and Finance professionals are usually comfortable working with this view of the asset base. That is because standard practice holds that assets in different categories may differ concerning:
- How assets help meet business objectives.
- Methods for asset lifecycle management.
- How the firm acquires the asset.
- How the firm values the asset.
- Whether or not the asset value is subject to depreciation or amortization.
Traditional Accounting and Finance essentially view each asset category as an investment portfolio. The approach is to manage and optimize each portfolio with its methods.
The Property, Plant, and Equipment Assets Portfolio
Fixed Assets and Other Capital Assets Categories
Exhibit 4 shows one company's "Investment portfolio" in Property, Plant, and Equipment assets.
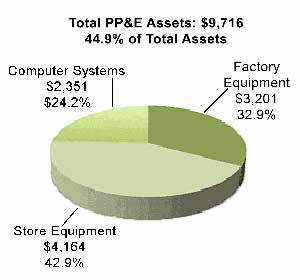

The Property, Plant, and Equipment Assets (PP&E assets) and perhaps other capital categories include such things as buildings, factory machinery, office furniture, large computer systems, and vehicles. Firms usually choose and acquire PP&E assets through a competitive capital review process. This process emphasizes:
- What the asset contributes towards meeting business objectives and operational needs.
- The asset's economic life.
- The total cost of ownership.
- What the asset will add to the firm's ROA.
Asset Life Cycle Management for PP&E Assets
Some firms describe PP&E assets as capital assets or fixed assets. Note especially that traditional asset life-cycle management applies primarily to holdings in these categories. That is because most of these assets have a lifecycle, prescribed depreciation life, and known total cost of ownership.
For example, assets under any of these headings usually create depreciation expense every year of their depreciable lives. And this, in turn, impacts both the firm's Income statement and balance sheet.
- First, depreciation expense lowers Net income, the Income statement "bottom line." This results in tax savings for firms that pay tax on operating income.
- Second, depreciation expense lowers the asset's balance sheet value. Depreciation expense, in other words, reduces total asset base magnitude.
As a result, depreciation expense impacts both components of the return on assets ROA ratio. A lower net Income means lower "R" for the ratio, while lower total assets mean lower "A." Depreciation, therefore, plays a key role in ROA performance of the PP&E "investment portfolio."
Firms in Some Industries Must be PP&E Asset-Intensive.
The relative size of the PP&E "slice" in a pie chart, like Exhibit 4, varies from company to company and especially between companies in different industries.
- For firms in capital-asset-intensive industries (such as construction, transportation, and manufacturing), PP&E assets may be well over 50% of the asset base.
- For companies in insurance, software development, or financial services, the Capital or PP&E percentage of the asset base may instead be much smaller. Capital assets for these firms may consist of little more than office furniture and computer systems.
Reducing the Asset Base
In any case, while a company may use such assets, it may not need to own them. When ROA performance is weak, firms sometimes try to reduce the size of the asset base substantially. The purpose is to reduce the "A" in ROA without reducing the "R," thereby increasing ROA. The challenge, in other words, is to reduce the asset base without lowering earnings.
- Some firms reduce the asset base and improve ROA by choosing to lease capital items such as buildings, vehicles, and computer systems, instead of owning them.
- Similarly, moving from in-house manufacturing to outsourcing can also reduce the asset base and improve ROA.
However, changing to leasing or outsourcing is not always advantageous. Either kind of change calls for higher spending on operating expenses. And, this may or may not offset the benefits of lower asset management costs. In other words, the firm must be able to run efficiently in its usual line of business with a smaller asset base.
The Current Assets Portfolio
Assets convertible to Cash in the Near Term
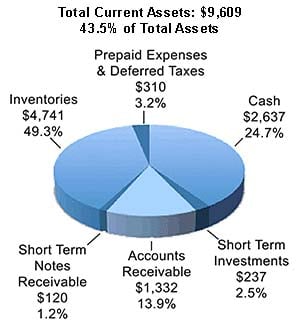
Current assets provide the company's liquidity. These assets are either cash itself, or assets that can—at least in principle—quickly become cash. As the pie chart in Exhibit 4 below shows, the three major Current assets components are cash, inventories, and Accounts receivable. Liquidity metrics such as working capital or the current ratio all reflect the totals in these Current assets categories.

Current Assets: Cash on Hand.
Cash on hand is necessary for meeting immediate spending needs. These include needs such as paying employee salaries, day-to-day operating expenses, or other short-term obligations. Sufficient cash on hand also makes possible a quick response to changing market conditions or competitors actions. And, with enough money, the firm can invest in product development and infrastructure upgrades.
A cash shortage can prevent such investments. And, a severe cash shortage also puts the company at risk of defaulting on payments due to lenders or even meeting payroll.
Most firms, therefore, make it a priority to maintain sufficient cash for short-term needs, but without building a large cash surplus. A large cash surplus is undesirable because money sitting idle in an asset account is not earning interest or otherwise working productively.
Current Assets: Inventories
Inventories are essential for meeting production needs and customer needs. In manufacturing companies, inventory categories typically include raw materials, work in progress, and finished goods inventories. A retail business, on the other hand, may have only merchandise inventories, waiting for purchase by customers. In either case, acquiring, handling, and holding the stock can bring significant costs.
Inventory management is the art of maintaining enough inventory to meet customer and production needs while keeping inventory size and holding time for the stock to an absolute minimum. When firms achieve these objectives, scores on activity and efficiency metrics such as Inventory turns and Days sales in inventory improve. And, the company's ROA improves at the same time. Opposite results occur when excess inventory sits idle. Stock sitting idle is not working productively, causing efficiency metrics and ROA to suffer.
Current Assets: Accounts Receivable
Accounts receivable are monies owed to a company for goods or services sell and deliver before the customer pays for them. The only companies in business that do not have accounts receivable are the rare companies that trade on a "cash only" basis. Accounts receivable legitimately belong in the category Current assets because they should convert to cash in the near term, typically within 30 days or less.
The challenge for management with Accounts receivable is to prevent accounts that are due from remaining unpaid beyond their due date, slipping beyond the stated due period or, worse, having to be written off as bad debt. Most companies expect they will never collect a small percentage of their Accounts receivable. In the interest of reporting accuracy, they recognize this reality with an account with the name Allowance for doubtful accounts.
Firms measure their ability to manage Accounts receivable effectively with activity and efficiency metrics. These metrics include "Accounts receivable turnover," and "Days sales outstanding." Improvements in these metrics also improve overall company ROA.
The Long-Term Investments and Funds Assets Portfolio
Securities Investments Held for the Long-term
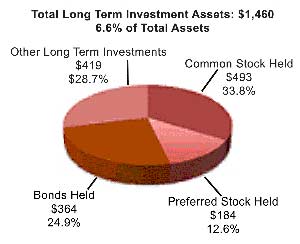
Many companies own shares of stock in other companies. Many also own bonds from other companies or governments. Companies that are not themselves in the investment industry use such holdings, primarily to supplement their regular income. Exhibit 6, below, shows one company's "Investment assets" portfolio.
The Income statement has a category specifically for reporting revenues and expenses due to such investments. Firms claim these items separately from the revenue and expense items for the firm's usual line of business. Note especially that long-term investments of this kind can (or should) produce income just as a consequence of ownership. Financial income from long-term investments and their balance sheet values, of course, contribute to overall company ROA.

Owning LT Securities: For Investment or Control?
Firms sometimes buy, hold, and trade long-term funds and investments to earn income. In such cases, they optimize these investments with traditional portfolio management methods. However, note that firms also acquire securities for another purpose, as well: to control another company.
When company A owns 50% or more of Company B's voting stock, Company A has an active majority interest in Company B. In such cases A (the parent company) can control B (the subsidiary) in two ways:
- First, by choosing B's Board of Directors.
- Second, getting its desired outcome for every issue that stands for a shareholder vote.
Companies still exercise a substantial measure of control over other companies by taking an active minority interest. "Active minority" usually means owning 20% - 50% of another company's voting stock. Consequently, "active" minority owners exercise control by persuading other shareholders to vote with them to make a majority block.
Therefore, when one company owns another company's voting stock for control purposes, investment "returns" include more than dividends and share price increase. As a result, not all asset "returns" factor directly into the ROA calculation.
The Intangible Assets Portfolio
Legal Intangibles and Competitive Intangibles
Intangible Assets include such things as:
- Intellectual property (Proprietary knowledge, formulas, or trade secrets)
- Copyrights
- Trademarks
- Patents
These are legal intangibles, meaning courts of law will defend them. As a result, owners benefit from these assets by merely having the right to prevent competitors from using them. Beyond this, however, the magnitude of financial gains from these assets is usually not easy to measure. Only when the firm sells such assets to another company are economic benefits evident.
Legal intangibles legitimately qualify as assets because firms acquire them at a specific cost and they have value for the business.
Intangible Assets: Competitive Intangibles
Intangible assets also include the so-called competitive intangibles, which they generally cannot defend in court. Familiar competitive intangibles include company reputation and brand recognition. There is no question that these intangibles can sometimes have very high value for a company:
- Successful branding allows sellers to charge premium prices for products and services. As a result, brand names such as Apple, Armani, or Disney, provide their owners with more substantial margins.
- When the brand or company has a negative image, negative, sales and profits may drop precipitously. The brand can become harmful, for example, when products carrying the brand result in customer injuries. Recent examples include exploding cell phone batteries, and automobiles with brakes that fail. In such cases, unfortunately, brand value means sales losses.
Intangible Assets Contributions to ROA Are Indirect and Long-term
Both classes of intangibles (legal and competitive) contribute to "Returns" in ROA. For these assets, however, the contribution is almost always long-term and indirect. That is because Intangible assets add value by improving the company's ability to:
- Compete effectively in the market
- Deliver unique products and services.
- Charge higher prices and receive higher margins because of brand strength.
Strategic Approach to Asset Structure and ROA
Return on Asset Performance for the Assets Portfolio
The strategic approach to asset structure takes the view that there is an ideal or optimum asset structure for each company. The optimum structure for any firm will reflect the:
- Company's industry and the nature of its core business
- Company's business model and strategic objectives
- The intensity of Competition in the company's markets
- Current economic conditions
Indeed, there are significant differences between the asset structures of companies in different sectors. There are also striking differences between the asset structures of companies in the same industry, which have different business models.
Exhibit 6 below shows how asset structures can vary, substantially, between industries. The image shows the asset structures for companies in three different sectors: Technology, Insurance, and Heavy manufacturing.
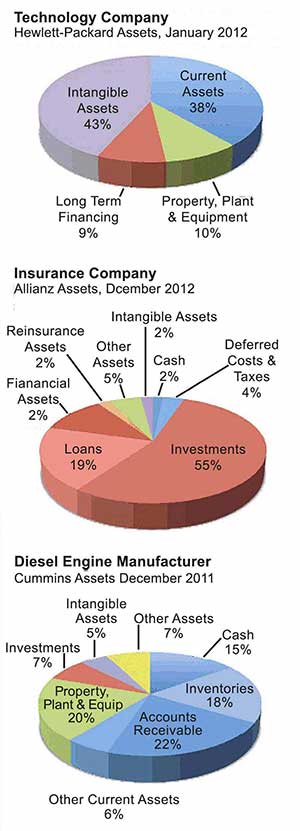

These structures differ from each other in quite a few ways. A few striking differences include the following points.
Industry differences: Property, Plant and Equipment Assets
For Cummins (a diesel engine producer), "Current assets" in four segments account for 61% of the asset base. And, Cummins next largest asset component, not surprisingly, is property plant and equipment.
Current assets are also a significant component for Hewlett-Packard (a technology company) at 38% of the asset base, but property, plant equipment's share of the asset base is only 10%.
For Allianz Group (an insurance company), Current assets and property plant and equipment are almost invisible in the high-level view of its asset structure.
Industry Differences: Intangible Assets
Relatively small parts of the asset base consist of intangible assets for Cummins(5% of total assets) and Allianz (2% of total assets). For technology companies, however, intellectual property assets may carry a very high book value. For Hewlett-Packard, for instance, intangible assets account for 43% of the company's asset base.
Industry Differences: Financial investments
In the insurance industry, the significant portion of company income typically does not derive from the difference between customer premiums and claim payments. Insurance companies, that is, do not earn primarily from "profits" on policies. For insurance companies, most income results instead from the company's ability to invest funds. It is also not surprising, therefore, that 85% of the Allianz asset base consists of investments, loans, and financial assets.
Solution Matrix Ltd® 292 Newbury St Boston MA 02115 USA
Phone +1.617.849.8478 • Contact Form • Privacy Policy • About Us • Sitemap
Terms of Service • Refunds • Customer Service • Safety & Security
Copyright © 2004–2024 by Solution Matrix Ltd • All Rights Reserved

