What are Financial and Capital Structures?
Balance sheet structures reveal leverage. Leverage magnifies either profits or losses—depending on the economy.
Business people use the term Structure in quite a few different ways. The terms governance, business and legal, are all associated with their own structures for instance. Those terms refer to aspects of the company set up and operation.
Two other similar terms describe the nature of the company's financial position: Financial Structure and Capital Structure. Both structures concern the "Liabilities + Equities" side of the Balance Sheet Equation
Assets = Liabilities + Equities.
- Financial Structure refers to the balance between all of the company's liabilities and its equities. It thus concerns the entire "Liabilities+Equities" side of the Balance sheet.
- Capital Structure, by contrast, refers to the balance between equities and long-term liabilities. Short-term liabilities do not contribute to Capital Structure.


For comparing the firm's debt to its equities, Financial Structure is, therefore, more sensitive than the Capital Structure to short-term liabilities. "Financial Structure" reflects the status of working capital and cash flow, salaries payable, accounts payable, and taxes payable. The Capital Structure does not.
Capital Structure, on the other hand, refers to the makeup of the company's underlying value. Here, Capital Structure focuses on the balance between funding from equities and financing from long-term debt. The presumption is that firms use funds from both sources to acquire income-producing assets. Capital Structure is also known as Capitalization.
Explaining Structures and Leverage in Context
Sections below further define and illustrate Structures and Leverage in context with related terms and concepts, focusing on four themes:
- First, how the balance sheet defines financial and capital Structures from Liabilities and Equities.
- Second, how structures create leverage, and it lets owners and creditors share business risks and rewards.
- Third, calculating and using metrics for capitalization, including Long Term Debt to Equity. Also, metrics for Financial Leverage, including Total Debt to Equity.
- Fourth, leverage and debt impact on Financial Risk, Return on Equity and Earnings Per Share and how firms target optimal debt levels.
Contents
Define Financial and Capital Structures
Structures Represent Balance Sheet Liabilities and Equities
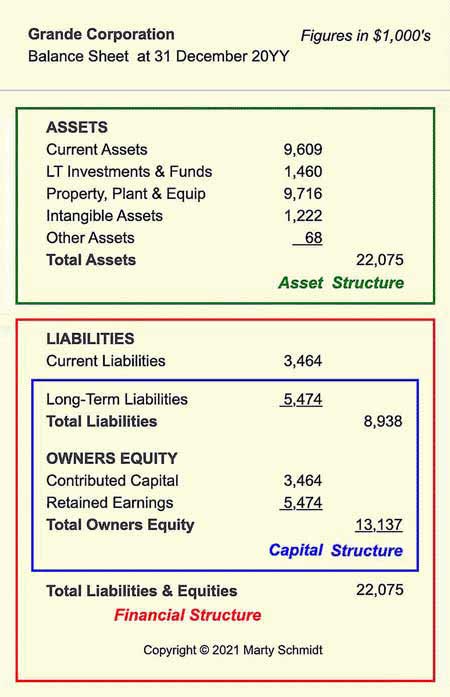
Exhibit 1 shows how Financial and Capital Structures appear on a firm's Balance sheet.


Groups of Balance sheet items define three structures for the firm:
- Asset Structure.
- Financial Structure.
- Capital Structure (Capitalization).
For the analyst, describing and evaluating each structure is primarily a matter of comparing the relative magnitudes of items within the structure.
- Financial and Capital Structures show how investor owners and lenders share risks and rewards of company performance. As a result, these structures describe leverage.
- Asset Structure shows how the firm chooses to maximize return on assets ROA.
For more on the meaning of these metrics see the following:
Defining & Measuring Financial Structure
Metrics for Measuring Financial Leverage
Financial structure describes the sourcing of all funds a company uses for acquiring assets and paying expenses.
Financial Structure Funds Sources
There are only two kinds of sources for all such funds:
- Firstly, Debt financing.
Firms acquire funds through debt financing, primarily from bank loans and the sale of bonds. These usually appear first on the Balance sheet as Long-term liabilities. Note especially that the company's debt (Balance sheet liabilities) also includes near-term obligations such as short-term notes payable, accounts payable, salaries payable, and taxes payable. - Secondly, Owners equities.
These are what the company owns outright, appearing on the Balance sheet under "Equities" (or "Stockholders Equities"). Equities, in turn, come from two sources:- Paid in Capital
These are payments the firm receives for stock shares investors purchase directly from the firm when it issues shares. - Retained Earnings
Retained earnings are after-tax profits (earnings) the company keeps after paying dividends to shareholders.
- Paid in Capital
These sources taken together are one full "side" of the Balance sheet. Businesspeople interested in the firm's Financial Structure will compare the percentages of total funding from each source. The relative rates define the company's financial leverage, which determines how owners and creditors share business performance risks and rewards.
Defining and Measuring Financial Leverage
One primary measure of the balance between funding sources is a leverage metric, Total Debt to Equities Ratio. This metric is sometimes called simply the Debt to Equities Ratio, or even more simply, Debt Ratio. Analysts interpret this metric as a measure of financial leverage, or "trading on equity."
Be aware that a similar but different leverage metric, the Long-Term Debt to Equities Ratio appears in the next section belowon calculating the Total Debt to Equities Ratio.
Some textbooks symbolize this ratio as B/V, where B is the company's total debt, and V is "Company Value" or total equities. Some analysts prefer to symbolize the same ratio as D/E, where B is the total debt and E is total equities.
Calculating Total Debt to Equities Ratio
(Financial Leverage)
The Total Debt to Equities Ratio is calculated from entries on the firm's Balance Sheet. Figures for this example are from the "Financial Structure" region of Exhibit 1, above.
For Grande Corporation, at the end of the reporting period:
Total liabilities = $8,938,000
Stockholder equities = $13,137,000
Total debt to equities ratio (B/V):
B/V = Total liabilities / Stockholders equities
= $8,938,000 / $13,137,000
= 0.68
Increasing debt funding has two results. Firstly, the Debt to Equities Ratio increases, and secondly, the firm's Financial Structure leverage increases.
For the implications of different leverage values, see the section below:
Defining & Measuring Capital Structure
Metrics for Measuring Capitalization
Capital Structure describes the sources of funds a company uses for acquiring income-producing assets. The focus of these funds contrasts with the Financial Structure Concept (previous section) which includes all of the company's debt and equities.
Regarding debt, Capital Structure considers instead only the firm's long-term liabilities. As Exhibit 1 shows, Capital Structure items lie on the "Liabilities + Equities" side of the Balance sheet but exclude Current Liabilities.
Those interested in a firm's Capital Structure will compare the percentages of total funding for income-producing assets that comes from each source. They want to know, that is, whether capital funding is primarily equity funding or debt funding.
Defining and Measuring Capital Leverage
One measure of the balance between capital funding sources is another leverage metric, the Long-Term Debt to Equities Ratio. Note that this ratio is very similar to the Financial Leverage metric above. However, this ratio, using only long-term debt, serves to measure the firm's Capital Leverage.
Calculating Long-Term Debt to Equities Ratio
(Capital Leverage)
Like the other metric, above, based on total debt, the Long-term debt to equities ratio derives from entries on the firm's Balance sheet. Figures for this example appear in the "Capital Structure" region of Exhibit 1above:
For Grande Corporation, at the end of the reporting period:
Total Long-term liabilities = $5,474,000
Stockholder equities = $13,137,000
Total Long-term debt to Equities ratio
= Total Long-term liabilities / Stockholders equities
= $5,474,000/ $13,137,000
= 0.42
The greater the debt funding component (the higher the long-term debt to equities ratio), the higher the degree of leverage in the company's capital Structure.
Note that Grande Corporation's "capital leverage" (0.42) is lower than its "financial leverage" (0.68). "Financial leverage" will, in fact, always be higher than "Capital leverage," except in the improbable case that the firm has no short-term debt.
For more on the implications of differing leverage levels, see the sections below:
Leverage Benefits and Risks
Business Risk, Financial Risk, and Gearing Ratios
A high degree of leverage has several implications for owners and creditors.
- Firstly, if and only if business performance is healthy (as in a good economy), the following holds: High leverage provides owners with higher profitability and a higher return on investment (or return on equity) than low "leverage."
- Secondly, when a business is doing poorly, leverage gives owners lower profits and lower return on equity, than when it is higher.
- Thirdly, the higher the degree of leverage the higher the potential rewards and also the higher the potential loss for owners.
Business Risk
One consequence of high leverage is an increase in Business Risk. Here, the term refers to the risk of low earnings. Analysts typically define business risk for a firm as follows:
Business risk
= Potential variability of before-tax profits from assets
Where "Before-tax earnings from assets" is the accountant's familiar selective income metric "Earnings Before Interest and Taxes."
Where "Potential variability" = A range of possible EBIT results.
A thorough risk analysis will include a probability density function across the range of possible resultls, allowing quantitive estimates of different outcome probabilities.
When leverage is high, business risk is high. And, when business risk is high, the range of possible EBIT results is extensive. On the other hand, with low business risk, potential EBIT results cover a much narrower range.
For more on using Balance Sheet Figures to derive EBIT, see the article:
Financial Risk
Besides Business Risk, analysts also have a keen interest in another risk factor that accompanies high leverage: Financial Risk. Financial Risk refers to the possibility that a firm might not be able to meet its financial obligations. Not surprisingly, the financial risk rises with rising debt level. And, this means that "financial risk" increases as leverage increases.
Note that from its EBIT, a firm must first pay interest due on loans, bonds, and service other debt, before paying shareholder dividends or retaining earnings. With higher leverage, the firm has more debt service to pay. When profits are low, therefore, the firm with high leverage risks being unable to meet its financial obligations. Not surprisingly, when a company has a high financial risk, its credit ratings and bond ratings suffer.
Gearing Ratios for Leverage Metrics
Analysts commonly use the term Gearing Ratio or ("Gearing") when working with leverage metrics. The term "gearing" suggests mechanical gearing, where a smaller gear wheel gains leverage (power) by turning a larger wheel. Similarly, in business, owners and their relatively smaller equity gain leverage to bring in more substantial earnings by using relatively more debt financing (higher gearing).
In any case, the term gearing ratio may refer to at least four different metrics:
- Total Debt to Equity Ratio
This ratio appears in textbooks as B/V,
Where B = Total Debt and V = Value, or Total Equity.
- Total Debt/Total Assets
This ratio appears in textbooks as B/TA,
Where B = Total Debt and TA = Total Assets. - Total Stockholders Equities Times Interest Earned
- Equity/Assets Ratio or Equity Ratio
For more on the meaning of these metrics see the following resources:
Examples in the next section show how high leverage can bring high owner returns (high earnings per share, high return on equity) if sales revenues are substantial. They also show how profits and owner returns suffer in a high-leverage company when sales are weak.
What Does Leverage Do for investors?
Sections above discuss the impacts of Capital Structure, Financial Structure, and leverage, on owner/investor gains. The ways these factors interact are probably easiest to grasp in the context of a concrete example.
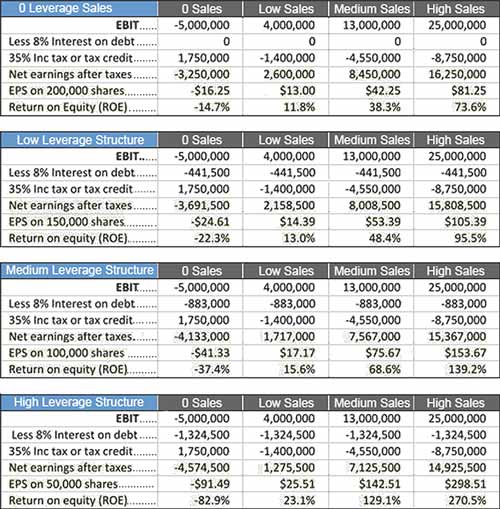
The numerical example in this section shows the potential impact of leverage and sales performance as they affect investor gains and losses. Exhibit 2, below, also shows the effect on company earnings. The next section explains how to measure the risks that go with different sales and leverage figures.
Example: Investor Gains and Losses as a
Function of Leverage and Earnings
This example considers four levels of sales performance, and the resulting investor gains or losses at four degrees of leverage.
Example Sales Levels
Consider first the before-tax earnings (Earnings Before Interest and Taxes, EBIT) that a company expects under each of four possible levels of sales revenues.
Management believes there is a small but real probability that sales next year will be 0. That outcome could result from a crippling labor strike or the loss of several lawsuits pending against the company. They also estimate three other levels of sales, ranging from "Low" to "High." Each column of Exhibit 2, below, shows the impacts for investors under one of the following levels of sales:
- Col 1. Sales=$0 & EBIT=–$5,000
- Col 2. Sales=$15,000 & EBIT=$4,000,000
- Col 3. Sales=$30,000,000 & EBIT=$13,000,000
- Col 4. Sales=$45,000,000 & EBIT=$25,000,000
Example Levels of Leverage and Impact on EPS and ROE
The Exhibit 2 example in the next section below shows the impact of sales revenues and leverage on three metrics that represent investor gains:
What will be the impact of sales revenues on investor earnings per share and return on equity? The answer is: That depends on the Financial Structure of the company, especially the degree of leverage. Exhibits 2 and 3 below show these impacts at four different leverage structures.
Example: Leverage Impact on Earnings, EPS, ROE
Exhibit 2 below represents Leverage with two gearing ratios, or leverage metrics:
- Total Debt to Equity (B/V).
- Total Debt to Total Assets (B/TA.
These derive directly from the figures above for Total assets (TA), Total debt (B), and Total equity (V).
In Exhibit2, Leverage starts at 0 for the top panel and then moves higher in lower areas. For the four panels B/V ranges from 0 total debt to equity (B/V) ranges from 0.0 to 3.00, while the debt to assets ratio ranges from 0.0 to 0.75.


Example Charts: Leverage Impact on Earnings, EPS, ROE
The four chart paneels in Exhibit 3 below represent the table figures from Exhibit 2. All four charts show:
- The impact of leverage on investment gains is about the same, regardless of which leverage metric is in view (B/V or B/TA).
- The impact of leverage on investment gains is about the same, regardless of which investor gain metric is in view (EPS or ROE).


The four graphs in Exhibit 3 represent the table figures from Exhibit 2. All four charts show:
- The impact of leverage on investment gains is about the same, regardless of which leverage metric is in view (B/V or B/TA).
- The impact of leverage on investment gains is about the same, regardless of which investor gain metric is in view (EPS or ROE).
The four lines in each graph each represent a different level of sales revenues, ranging from 0 sales at the bottom to high sales at the top. Regarding sales revenues, the charts show the following:
- In all four graphs, the plotted lines bunch closely together at left (0 leverage) and then fan out moving right towards higher "leverage."
These charts show that investors have much more to gain, as well as much more to lose under high leverage. Regarding the top graph, "Earnings per share vs. Debt to Equity (EPS vs. B/V):"- At 0 leverage, the range of possible EPS returns is small. At 0 leverage, EPS ranges from negative to positive, from –$16.25 (with 0 sales) to $81.25, a range of $97.50.
- The range of possible EPS returns is about three times larger under high leverage. Under high leverage, EPS ranges from negative to positive, from –$91.49 to $298.51, a range of $390.00.
Leverage Source: The Relative Magnitudes of Equity vs Liabilities
In Exhibit 3, four structures have the same total asset book value ($22,075,000). In other words, all four structures have the same "Asset side" of the Balance sheet.
What differs between structures is the other side of the Balance sheet: Shareholder Equity + Liabilities must, of course, equal the asset's $22,075,000. Note especially, however, that the four levels of leverage distribute that total differently between equities and debt.
Each structure has the same equity value per share of stock outstanding ($110). However, as the size of the equity component decreases (going from 0 leverage to high leverage), the number of shares outstanding also decreases.
When is There Too Much Debt?
Too Little Debt?
Several groups have a keen interest in knowing a firm's financial and Capital Structure:
- Firstly, lenders considering making loans to the company.
- Secondly, investors considering buying the firm's securities
- Thirdly, the firm's officers and senior managers, regarding the acquisition and use of funds
All will want to judge whether the company is carrying "too much" or "too little" debt.
Too Much Debt
A company has too much debt when debt service costs are burdensome, that is, when
- The company cannot readily pay interest due on its bonds and bank loans.
- Debt service costs reduce net income to an unacceptable level.
- There is a high risk that the company may default on its loans or bonds.
In a high leverage company, the risk of these unpleasant outcomes rises if profits and profitability decrease or if the general economy enters a period of low growth.
In conclusion, high levels of leverage are dangerous in weak economies or any other time when a company's earning prospects are poor.
Too Little Debt
A firm is probably carrying too little debt when these conditions exist:
- There is a credible opportunity to grow revenues and profits by increasing investments in income-producing assets
- There is a real opportunity to improve revenues and earnings by increasing spending on research and development, marketing, infrastructure renewal/modernization, or reorganization.
- Earnings and equity funding are not providing sufficient funds to pursue these opportunities.
- The company should be able to pay additional debt-service expenses, without lowering profits unacceptably.
In brief, increasing leverage may be advisable when the company can readily afford additional debt service costs, and when more loans enable investments that promise a good return. "Good returns" are returns that outweigh the costs of borrowing.
Acceptable Leverage Metrics and Target Leverage Metrics
In deciding whether the company's Capital Structure brings leverage that is either too high or too low, investors will consider several factors. They will compare the firm's Earnings Before Interest and Taxes (EBIT) to several factors.
- Firstly, investors consider Industry standard EBIT.
Comparing company EBIT to EBIT for other companies in the same industry indicates whether or not the company has stronger or weaker earning power relative to its competitors. - Secondly, investors consider the firm's Net Earnings. (Earnings After taxes and Interest)
Comparing EBIT to Net earnings for the same period indicate whether or not financing costs (interest) are reducing profits to an unacceptably low level.
Also, in deciding whether the debt load is too high or too low, investors will also consider other factors. They may, for instance, compare the firm's debt/equity ratios to industry standards. Note that industry norms or standards vary greatly between industries.
- Companies in capital-intensive industries such as automobile manufacturing, for instance, often finance capital assets through debt. This practice results in a Debt-to-Equity ratio" higher than 1.0.
- Companies in the technology sector, by contrast, typically raise funds by issuing stock. This approach results in Debt-to-Equity ratios on the order of 0.20 - 0.40.
Finally, investor analysts will also evaluate factors such as these carefully:
- Trends or recent changes in the company's Financial Structure and capital Structure. They will want to know whether the reasons for significant changes were temporary (or one-time).
- Individual sources of the company's debt, as well as total debt help explain the actual cost of debt service, the risk of default, and the company's prospects for re-negotiating debt if necessary.
- The company's likely earnings performance for the foreseeable future
These factors should be adequate for debt service and still provide acceptable retained earnings or shareholder dividends.
Capital Structure and Sharing Risks and Rewards
Capital Structure, moreover, shows how the firm divides risks and gains between investor owners and investor creditors:
- If a firm with high leverage fails and enters bankruptcy, creditors will probably take the more significant loss. They stand to lose more because the company may have to write off its loan debt, and bondholders may find their securities worthless.
- On the other hand, if a company with very low debt-to-equity ratios fails, it will likely pay off its creditors. When a bankrupt company liquidates, creditors have preference over shareholders in receiving liquidation funds. As a result, a low debt-to-equity ratio means there will probably be enough funding to cover outstanding obligations
How Do Firms Change Capital and Financial Structure?
For most companies, Financial Structure and Capital Structure change by small amounts more or less continuously. They change because the values of several structural components may be relatively fluid from period to period: short-term liabilities, long-term liabilities, and even retained earnings, for instance.
For the short-term, a company can deliberately increase leverage by taking out loans or issuing bonds. The company can, for instance, abruptly decrease "leverage" and increase equity by a new issue of stock. Absent these actions, a profitable profit-making company will gradually reduce leverage as long-term loans and bonds are paid off, and as retained earnings from profits grow.
Solution Matrix Ltd® 292 Newbury St Boston MA 02115 USA
Phone +1.617.849.8478 • Contact Form • Privacy Policy • About Us • Sitemap
Terms of Service • Refunds • Customer Service • Safety & Security
Copyright © 2004–2024 by Solution Matrix Ltd • All Rights Reserved

