
What is the Income Statement?
The Income Statement reports the firm's success or failure achieving the highest level objective in private industry: earning profits.
The Income statement (I/S) is one of the four primary financial statements that public companies must publish every quarter and year. The I/S reports the period's incoming revenues along with the outgoing expenses that brought them, making it the "go to" source for anyone with questions about the company's sales performance or earnings performance.
The I/S reports transaction totals transaction in the firm's Revenue and Expense accounts for an accounting period—usually a quarter or fiscal year. The I/S, in other words, shows the period's incoming revenues along with the outgoing expenses that brought them, These figures, in turn, enable direct calculation of the firm's earnings (profits) and margins for the period. For this reason, the Income Statement also carries the name Profit and Loss Statement, or P&L.
Define Income Statement
The Income Statement (I/S) is one of 4 primary financial statements that public companies publish after every quarter and year. The I/S reports transaction totals in the firm's Revenue and Expense accounts for an accounting period—usually a quarter or fiscal year.
Expense and revenue accounts appear on the I/S so as to implement in detail the Income Statement Equation:
Net Income = Total Sales Revenues – Total Expenses
The other three mandatory statements are the Balance Sheet, the Statement of Retained Earnings, and the Statement of Changes in Financial Position. Note that some firms and most government organizations publish what is essentially their Income statement under the name "Statement of Operations" or something similar.
.")
.")
For investors and analysts, a firm's income is a measure of its earnings performance for the period. Business textbooks typically present the highest level objective for profit-making companies as increasing owner value. Earning income meets this objective by adding to retained earnings (which build owners equity) and paying dividends directly to shareholders.
The Income statement equation shows how income derives from the period's revenues and expenses:Income = Revenues – Expenses
The Income statement itself is simply a detail version of this equation. It is essentially little more than a list of the firm's Revenue and Expense category accounts and their transaction activity totals for period. The statement also adds and subtracts some of these figures, to show three profits: Gross profit, Operating profit, and Net profit (Net income). Exhibit 1, below, shows an example statement.
Explaining Income Statement in Context
This article further defines and illustrates Income statement structure and content with examples, emphasizing three themes:
- First, the role and purpose of the Income Statement in financial reporting.
- Second, the income statement relationship to other statements that appear at the end of the accounting cycle, including the Balance Sheet, Retained Earnings Statement, and Cash Flow Statement (SCFP).
- Third, Income Statement structure and contents, including income metrics for measuring financial performance.
Contents
- What is an Income statement?
- Simple example Income statement: The meaning of income.
- What are other terms for Income and Income statement?
- Where do firms publish the Income statement?
- Where does the Income statement report financial performance?
- The Income statement explained with an example.
- What are "margins?" How do margins measure earnings performance?
- Which critical financial metrics and ratios use Income statement data?
Related Topics
- For more on earnings, profits, and margins, see Profitability. Also, see the article Margin.
- Explaining other financial Statements:
The Meaning of Income
Simple Example Income Statement
Public companies (companies that sell shares of stock to the public) almost everywhere must report financial performance and financial position, quarterly and annually. Privately held companies, however, may withhold such information from shareholders, competitors, and the public. They may not withhold it from tax authorities.
The Income statement purpose is to report the firm's income (earnings) for the period, as well as the period's revenues and expenses that resulted in that income. For this, the Income statement is, therefore, an application of the Income statement equation:
Income = Revenues – Expenses
The Income statement structure builds detail into each term of this equation. Exhibit 1 below is a simple (high level) Income statement example.


High-level income statements like this example emphasize major financial performance results:
- "Net" figures (e.g., Net income, Net Sales revenues, or Net financial gain).
- Totals for account item groups (e.g., Cost of Goods sold, or Total operating expenses).
- Profits (Gross profit, Operating profit, and Net Profit)
Where and When Do Income Statements Appear?
Shareholders and Investors Find Statements in the Annual Report
Firms usually publish an Income statement just after every fiscal quarter and year. Note that firms often release different versions, with more or less detail, for different audiences.
For shareholders and the general public, the most accessible version appears in the firm's Annual Report to Shareholders. Public companies publish and send this report to shareholders before their annual meeting to elect directors. Shareholders may receive printed copies by mail, but anyone can access them on the firm's internet site. There, annual reports and financial statements frequently appear under headings such as Investor Relations, or Investor Services.
For the Annual Report, the firm is legally responsible for publishing an Income statement and other reports that serve two purposes:
- First, these reports prepare shareholders to make voting decisions when electing directors.
- Second, help shareholders and investors evaluate the firm's recent financial performance and prospects for future growth. As a result, they support decisions on holding, buying, or selling stock shares.
Firms also publish financial statements that serve different audiences and other purposes. They prepare these reports for potential lenders and bond rating agencies, for instance. And they also make versions specifically for potential partners. Statements for these audiences call for specific details they may omit from the Annual Report version. For more on other Income statement audiences and purposes, see the article Materiality Concept.
The Income Statement Has Other Names
The Meaning of Earnings, Profits, and P&L
The term income is virtually synonymous with a few other terms, such as earnings and profits. Some people also speak less formally of the bottom line, referring to the position of Net income (Net profit) on the Income statement. Finally, the "bottom line" Net income is sometimes called "residual profit," or "residual income." The term "residual" applies because Net income is all that remains after subtracting all expenses from revenues.
Other Income statement results, however, include profits besides the bottom line Net profit. The Income statement also includes Gross profit, Operating profit, and sometimes other profits or Net gains. For more on the several profits, see the Exhibit 1 above and the section on Profits and Margins below.
Finally, note that some people refer to the Income statement as a Profit and Loss Statement or P&L. Others call it the Statement of financial performance or Statement of financial operations.
Also, even though profit-making objectives do not drive them, government and non-profit organizations still must report and account for incoming funds and outgoing expenses. These organizations, in other words, in fact publish an "Income statement." However, they governments and non-profit organizations usually title it Statement of Financial Operations, or something similar.
Where is "Financial Performance" on the Income Statement?
When an Income statement first appears, those with interest in company survival and growth generally try first to assess the firm's recent financial performance in its core line of business. The most direct measure for this purpose is Income statement Operating income (operating profit). Other results from revenues and expenses outside the core business may be large or small, beneficial or detrimental, but it is the core Operating income that signals the company's ability to operate profitably in its line of business.
In this regard, note especially that "bottom line" Net profit sometimes gives a less-than-clear picture of the performance results of most concern to investors and owners. Net profit, after all, can reflect contributions from noncash expenses (such as depreciation), taxes, the firm's financial investments, extraordinary items, and still other factors. These contributions sometimes "muddy the waters," that is, obscure actual performance results in the core line of business.
As a result, investors and owners sometimes prefer to discuss earnings as "Operating profit,+ but also as specific selective income metrics. These metrics also derive from Income statement revenues and expenses, but not all of them. These may include, for instance:
• Earnings before interest and taxes (EBIT)
• Earnings before interest, taxes, depreciation, & amortization (EBITDA).
See Earnings Before Interest and Taxes for more on the meaning and reasons for using EBITDA and other selective income metrics.
The Income Statement Covers a Specific Reporting Period
The Income statement title typically indicates the period in view with a phrase such as
"...for the year ended 31 December 20YY. "
"...for the quarter ended 30 June 20YY."
Stating a time span this way, contrasts with another financial accounting statement, the Balance sheet, which shows the status of assets, liabilities and owner's equities at one point in time, for example, "At 31 December 201Y."
High-Level Objectives: Net Income and Increasing Owner Value
In principle, profit-making companies exist and operate primarily to create value for their owners. The company's primary method of doing this is by earning income. The company's primary way of doing this is by earning income. Once it declares "Income" at the period end, there are only two things the firm can do with it:
- Declare all or part of Net income as retained earnings. This act increases owner value by increasing Owner's equity on the Balance sheet.
- Distribute all or part of the Net income to the company owners (shareholders) as dividends.This act provides owner value directly.
Another end-of-period report, the Statement of retained earnings, shows how the period's Income statement profits transfer either to the Balance sheet as retained earnings or shareholders as dividends.
The Statement of retained earnings equation is as follows:
Net income = Preferred stock dividends paid
+ Common stock dividends paid
+ Retained earnings
Retained earnings, in other words, are the funds remaining from Net income after the firm pays dividends to shareholders. Each period's retained earnings add to the cumulative total from previous periods.
Note incidentally, that firms sometimes declare dividend totals that exceed the firm's reported Net income. In principle, a firm can sometimes do this without having to reach into its cash reserves or borrow. The company can do so because, in reality, it pays dividends from the firm's net cash inflows for the period, and these can be greater than "Net income." This difference, in turn, is possible because Net Income can reduce with noncash expenses such as depreciation, or bad debt expense. The same noncash expenses do not reduce the firm's net cash flows.
Explaining Income Statement Contents
Detailed Example Statement
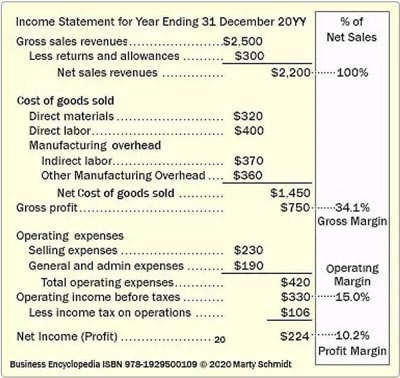
Exhibit 2 below is a high-detail version of the Exhibit 1 Income statement. This example might represent a manufacturing firm, but the general format and significant categories are typical for companies across a wide range of industries. A company that sells services instead of manufacturing goods might report "Cost of services" in place of "Cost of goods sold," but aside from a few such minor differences in terms, statement structure and content are nearly universal.
Revenues and Expenses Are Not Cash Flow
Reports of "Income," "Revenues," and "Expenses" do not necessarily represent real cash inflows or outflows. Not all of these signal the presence of cash flow for the following reason. Regulatory groups, standards boards, and tax authorities allow or require companies to use conventions such as depreciation expense, cost allocation, and accrual accounting on the Income statement.
Direct reports of actual cash flow gains and losses for the period appear on another reporting instrument, the Statement of changes in financial position (or Cash flow statement).
Income Statement Items Are Primarily Revenue and Expense Accounts
Those familiar with double- entry accounting may notice that most of the Income statement line items are also the names of accounts from the organization's Chart of Accounts—specifically, the organization's "Revenue" and "Expense" category accounts. For more on building the Income statement from accounts and account balances, see the article Trial balance.
Example Income Statement
Exhibit 2, below, is an example Income Statement with a typical level of detail for the Annual Report.


Income Statement Categories.
Income statements usually cover a reporting period, fiscal quarter or year, just after the period ends. They present the period's revenues, expenses, and income, in several categories. Exhibits 1 and 2 show, for example, how Income statement expenses fall into five major categories. The first three represent expenses from the company's usual line of business:
- Cost of Goods Sold
The costs of producing goods or services. Other companies may report this expense category as Cost of Services or Cost of Sales. - Operating Expenses – Selling Expenses
The costs of selling the goods or services - Operating Expenses – General and Administrative Expenses
Overhead, support, and management costs from across the company
Note that depreciation expenses may appear in each of these categories, depending on the use of the assets in question.
The remaining two major expense categories refer to both gains and losses from activities not in the company's usual line of business. This company is not, for instance, in a financial services industry. For this firm, therefore, financial transactions appear separately from those that contribute to core operating income.
- Financial Revenues and Expenses
These include revenues from funds the firm invests and expenses the firm pays to finance borrowing. - Extraordinary or Non-Recurring Items.
These may include substantial gains or losses from selling land or significant assets or from actions restructuring the company (e.g., the expenses of laying off part of the workforce).
What Are Margins?
How Do Margins Measure Earnings Performance?
Bottom line Net income is one measure of the company's financial performance for the period. However, the Income statement contains other performance metrics as well. The difference between Net sales revenues and Cost of goods sold is called Gross profit, for instance. And, net income from operations—before taxes, before gains and losses from financial and extraordinary items—is named, not surprisingly, Operating Income or operating profit.
Three of the Income statement profit Figures often appear as percentages of Net sales revenues: Gross profit, Operating profit, and Net profit. As percentages, these profits are margins. Exhibits 3 and 4, for instance, shows how a Gross profit of $750,000 represents one company's Gross Margin of 34.1%.
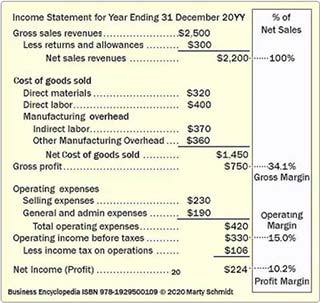
Exhibit 3. Companies report gross profit, operating profit, and net profit to the public and tax authorities on the Income Statement. These profits result from earned margins.
| Net Sales = $2,200 | Margin = Profit / Sales Revenues |
| Gross Profit = $750 | Gross Margin = $750 / $2,200 = 34.1% |
| Operating Profit = $330 | Operating Margin = $330 / $2,200 = 15.0% |
| Net Profit = $224 | Profit Margin = $224 / $2,200 = 10.2% |
Margins are useful for comparing business models and profitability between companies of different sizes. They are also helpful for tracking the earnings performance of a single firm across years, as the firm's business grows. Across long time periods, changes in profit figures show either that profits are rising, holding steady, or shrinking. Changes in margins, however, indicate whether the firm's profitability is growing, holding steady, or shrinking. Changes in margins, in other words, show that the firm's business model is changing.
Margins are Performance Indicators
Margins are critical indicators of company performance because they measure earnings at the heart of the firm's business model. Consequently, margins are of keen interest to stock market analysts, investors, boards of directors—and the firm's management.
- Analysts compare the firm's margins directly with competitors' margins and industry "best in class" standards. They pay attention to current margins, of course, but they also consider period-to-period trends in margins.
- Management will focus on margins for several reasons:
First, margins are central to the company's business model. Margins in the model, that is, show where and how the firm expects to make money.
Second, they watch for year-to-year changes in margins. Margins are a highly sensitive indicator of the company's ability to compete effectively and reach strategic objectives.
Third, margins for individual products and product lines are central to product planning and managing product portfolios. The Income statement shows, for instance, Gross margin for the firm.
However, underneath the firm's Gross margin (and hidden from competitors and the public), each product has a product-specific Gross margin as well. Only by knowing and managing the mix of individual product Gross margins can management optimize the Gross margin for the overall product set. In other words, product-specific Gross margins are essential for managing the product portfolio effectively.
Financial Metrics Using Income Statement Data
The term financial metrics refers to specific calculations used for analyzing financial statements. Many of these metrics use ratios to compare numbers and, as a result, financial statement metrics are also called "financial ratios" or "business ratios" by some—even though not all are, in fact, ratios. In any case, the word metrics refers to measurement. Financial metrics measure by revealing characteristics of a data set that might not stand out in a simple review of the data figures.
The metric Inventory turns, for instance, measures the firm's ability to use inventory assets efficiently. The metric makes a ratio from an Income statement figure (Net sales) and a Balance sheet figure (Inventories). Analysts interpret the result as the number of times the firm's inventory "turns over" in a year. The metric has meaning due to the fundamental business belief that assets should be working for the company and not sitting idle and unproductive.
Financial Metrics Families
Financial metrics that use Income statement and Balance sheet figures belong to several families. The members of each family address specific kinds of questions about the firm's financial performance or financial position.
Very briefly, these metrics specifically address questions like these:
- Can the firm meet its short-term financial obligations?
Liquidity metrics such as Current ratio and Working Capital address such questions. - Is the company using its resources efficiently?
Activity metricssuch as inventory turns address such questions. - Are the company's funds supplied primarily by owners or by creditors?
Leverage metrics, such as the Debt to asset ratio provide answers - Is the company profitable?
Profitability metrics such as Operating margin and Net Income address such questions. - Is the firm making good use of its assets?
Profitability metricssuch as Return on assets ROA and Return on Equity ROE address such questions. - What are the company's prospects for future earnings?
Valuation metrics, such as the Price to earnings P/E ratio deal with such questions. - How does the firm's 5-year growth compare to other firms? To industry averages?
Growth metrics such as the Cumulative average growth rate CAGR address such questions.
Many of the input data items for these metrics come from the Income statement.
For complete coverage of financial metrics, and of the interrelationships between Income statement, Balance sheet, and other financial statements, see the Excel-based ebook and template system, Financial Metrics Pro.