What Is a Financial Hurdle Rate?
Proposals competing for funding approval may have to clear the hurdle to stay in contention.
The Hurdle Rate test is familiar to people in business seeking funding approval for projects, acquisitions, or investments. Proposal reviewers and decision-makers generally view these actions as business investments—expenditures that must bring acceptable returns to justify their costs. They often use the financial Hurdle test as a preliminary screening test, to cull out incoming proposals that are not likely to deliver acceptable returns.
Define Hurdle Rate and Hurdle Test
Financial officers define Hurdle Rate as the minimum return rate they require for an incoming proposal before allowing the proposal to receive further consideration.
The Hurdle Test simply compares two Rate of Return figures.
- One figure is the return rate that the proposal author expects the action or investment to achieve over time.
- The second figure is an arbitrarily chosen hurdle rate (HR).
To pass the hurdle rate test, Rate #1 must equal or exceed Rate #2
Hurdle rate has other, less-colorful names: Minimum Acceptable Rate of Return (MARR), Required Rate of Return (RRR), and Target Rate (TR).
Screening Projects, Acquisitions, Special Actions
The hurdle rate is only a preliminary screening for incoming proposals—it is not the definitive final review.
- Proposals that out-perform the hurdle rate, credibly, advance to a full-scale proposal review, where they compete with other proposals for the organization's available funds.
- Proposals that fail the hurdle test due to a low score, or credibility issues, are essentially dead. These proposals typically receive no further consideration in the current review cycle.
Deciding Investment Proposals in One Step
By contrast, proposals for securities investments or other financial instruments, commonly face only the hurdle rate test. For these proposals, clearing a risk-adjusted hurdle rate usually leads directly to funding approval.


Two Ways to Clear the Same Hurdle
Financial officers usually perform the hurdle test by comparing two numbers directly.
- Test Approach 1. Proposal authors compute a rate of return for the proposal, then compare that directly with the target hurdle rate the organization sets for them. Proposals that exceed the target rate clear the hurdle.
The same people sometimes take a mathematically different approach to make virtually the same comparison indirectly.
- Test Approach 2. Start by calculating the net present value (NPV) of the proposal's net cash flow stream forecast. The organization's target hurdle rate serves as the discount rate (interest rate) for the NPV calculations. If the resulting NPV is positive, the proposal passes the hurdle test.
In most cases, these two approaches are mathematically equivalent or nearly so. The first approach is simple and easy for nonfinancial people to understand. The second approach makes the same comparison, but also provides a net present value NPV for the proposal—the magnitude of the future returns in present-value currency units. This NPV is useful information in funding contests where both large and small size requests are competing.
For more on test specifics, including adjustments for risk, see " The Hurdle Rate Test" below.
Hurdle Rate Purpose in Funding Decisions
The hurdle test serves two purposes that benefit the entire organization.
- First, the hurdle disqualifies proposals that cannot meet the organization's essential financial and risk criteria from further consideration. Hurdle rate screening lowers the risk of funding proposals that ultimately cost the organization more than they return.
- Second, the hurdle rate test lightens the workload for reviewers in the full-scale review process. Serious reviews are time and labor-intensive for everyone. Hurdle rate screening enables reviewers to concentrate on the more promising proposals.
Once the hurdle test is out of the way, reviewers then consider quite a few different criteria to develop priority scores for proposal. For this, proposal authors frequently provide reviewers with a complete business case analysis that…
- Projects likely costs, benefits, and risks that follow from accepting the proposal.
- Compares the outcomes likely from the proposal in view with results from alternative courses of action, or no action.
Credibility is the Real Hurdle Challenge
The challenge in the hurdle rate test is not merely producing a proposal rate of return that clears the hurdle. The real challenge, is to produce a credible rate of return figure that clears the hurdle.
Nearly everyone seeking funding approval knows in advance the "passing score" for the hurdle test. No surprise—very few show up for the test with a losing score in hand. In business, everywhere, the overwhelming majority of proposals that fail at the hurdle do clear the hurdle. They lose anyway because financial officers and reviewers have low confidence in the proposal's ability to deliver returns at that rate.
Critical Skills for Hurdle Test and Review
Certain business skills give proposal authors a competitive edge in preparing credible, realistic entries for the hurdle test. The same abilities incidentally, also enable the author to build strong business case support for the full proposal review that follows the hurdle test.
Success in both cases is more likely when the proposal author has the ability to …
- Design and plan project, action, or investment outcomes that deliver measurable business value.
In other words, success goes to those who plan outcomes that result in tangible progress towards meeting the organization's high-level business objectives. - Measure and quantify Business Value for both financial and nonfinancial outcomes. Often, this means the analyst starts by measuring progress towards nonfinancial targets, such as KPI improvements for customer satisfaction, safety, risk reduction, branding, organizational image, readiness, and employee morale.
- Measure proposal risks in quantitative terms. The proposal writer must build confidence in financial specialists, stakeholders, and sponsors that the proposal minimizes risks and measures what remains.
Key to Hurdle Success:
Proving Tangible Progress Towards Business Objectives
Sections below show how to prepare for the financial hurdle test, and then compute a rate of return for the proposal. See the six-step guide, "How to compete and win the financial hurdle rate event, in 6 steps," The financial math in Steps 2-6 is simple and straightforward. However, the key to hurdle test success appears in Step 1, which advises proposal writers to build business value outcomes into the proposal.
Step 1. Design a proposal action or project with target outcomes that deliver tangible business value.
In simple terms, Step 1 success means planning a project, action, or investment with outcomes that bring measurable progress towards meeting high-level business objectives. The proposal writer who masters these skills before trying to compute a rate of return or build a proposal business case is like the athlete who takes seriously the need to "get in shape" before the race.
Explaining Hurdle Rate in Context
Sections below focus on three themes.
- Defining and explaining the purpose of the hurdle rate test.
- Identifying business roles in business that are most likely to face the hurdle rate test. These include project and program managers, department heads, product managers,
- A six-step guide to competing in the financial hurdle event. The guide is for everyone seeking funding approval, who must first show that a proposal promises to clear a specific hurdle rate target.
Contents
Which Metrics Stand In For Rate of Return?
Rate of Return Can Be an Elusive Concept


Textbooks in finance and economics use the term rate of return for the calculated financial metric that proposal writers bring to the hurdle test. The intent is to assure stakeholders and owners that the investment is profitable and that risk levels are acceptable.
That purpose is fine, in theory, but the practical problem remains that Rate of Return does not have a single, standard definition. Quite a few familiar metrics arguably qualify as "rate of return" measures. These include Internal Rate of Return (IRR), Modified Rate of Return (MIRR), Average Rate of Return (ARR), Simple Return on Investment (ROI), Return on Assets (ROA), Return on Capital Employed (ROCE), and Return on Equity (ROE)—to name a few.
CFOs Usually Prefer IRR for the Hurdle Test
Every one of these seven investment metrics turns up now and then as the official rate of return for a hurdle test. All are possible because the hurdle rate metric is a judgment call from the Finance Department. Individual finance officers develop, over time, preferences for specific metrics they believe serve in their companies and their industries. As a result, a first-time proposal writer asking "how to compute a rate of return" for the hurdle test, may receive instructions for calculating any of the seven metrics above.
With those possibilities in mind, however, proposal writers should also know that the vast majority of financial specialists usually ask hurdle rate participants for one metric in particular: the Internal Rate of Return (IRR).
What You Need to Know to For Your Proposal
Sections below include a step-by-step guide to optimizing proposal performance in the financial hurdle rate test. See below the section below, "How to compete and win the financial hurdle rate event, in 6 steps." Step 2 in that process advises gathering information on three key points:
Step 2. Ascertain the specifics of the forthcoming hurdle test: Hurdle rate metric, time period scope, minimum passing score.
Who Competes in the Hurdle Event?
Step 2 measures and summarizes likely investment costs as cash outflows.
Many people first encounter the hurdle rate concept when they participate in the capital budgeting process. the hurdle rate is also center-stage, however, in quite a few other business processes. In reality, the hurdle rate can turn up anywhere that managers and reviewers receive, evaluate, and prioritize funding requests. The hurdle rate test is standard practice, now, in all of these areas:
Capital Budgeting and Capital Review
Capital budgeting typically begins with a capital review at the start of a capital budget cycle. For this, a Capital Review Committee solicits spending proposals and funding requests, organization-wide, for capital acquisitions and capital projects. The committee also sets a limit for total capital spending—a "capital spending ceiling."
Usually, the funding request total exceeds the capital spending ceiling, and this means that the committee will not fund every request. Incoming proposals must therefore compete for available funds. As a result, the Review Committee's primary tasks are to evaluate and prioritize all incoming submissions. For each proposal, evaluation begins with the hurdle rate test.
Project Management Office
PMOs in some organizations receive a large number of project proposals. The result is a heavy evaluation workload for a few PMO officers. Consequently, many apply the hurdle rate test to each income proposal, before taking on full-scale project proposal reviews.
Project proposals that clear the hurdle then move on to a thorough review and further consideration. The rest are non-starters.
Product Management Office
Competition is intense, and product life cycles are short in some In industries and markets. In such cases, product managers may submit new product proposals in high volume. Companies usually expect to bring only a small percentage of these to market.
In-depth reviews of product proposals will examine many factors, including marketing and sales considerations, of course, but also alignment with the company's overall product strategy. Before reaching the in-depth review, however, proposal sponsors may have to submit to the hurdle test.
Information Technology Directors
IT departments usually support units across the entire organization. As a result, IT directors sometimes receive a substantial number of proposals. These may include, for example, requests for new devices, new applications, new IT capabilities, or various other IT projects.
Most IT units, however, do not have the time and resources for meeting all incoming requests. Consequently, IT directors spend much of their own time evaluating and prioritizing IT support requests. Therefore, IT directors often require business case support with incoming proposals. And, they may choose to assess fully only those proposals that pass an initial hurdle rate screening test.
Continuous Improvement & Innovation Groups
Continuous Improvement / Innovation Groups. Some organizations create and charter groups specifically to facilitate "continuous improvement" or "innovation." These groups also receive action proposals from across the organization. And, such proposals typically vary substantially, in nature, size, and scope.
Group members will then evaluate incoming proposals regarding feasibility, risks, and added value to the organization. When proposal volume is high, the time and resource demands on group members also climb. In such cases, group managers can use the hurdle rate test to disqualify weak proposals early.
How to Clear the Hurdle in 6 Steps
Maximize your prospects for hurdle event success with six concrete steps:

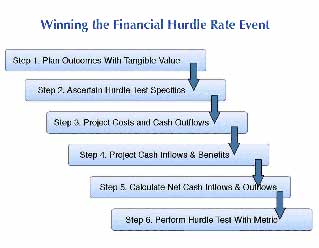
Clearing the Hurdle Step 1
Pursue Outcomes With Tangible Business Value


Step 1 builds participant fitness necessary for serious competition in the hurdle event.
Will the proposal pass the hurdle rate test? The answer depends, above all, on the proposal writer's ability to plan a project, action, or investment that delivers tangible, measurable business value—value that outweighs investment costs.
Bringing a high rate of return to the hurdle test may clear the target rate, but that by itself does not guarantee passing the test. Most proposals that fail the hurdle test actually clear the hurdle. They fail the test, however, because financial officers and reviewers do not believe the proposal can deliver returns at that rate.
Success in the hurdle test—and the business case review that follows—goes to proposal writers who can promise business value with credibility.. They must show in quantitative terms why and how the action does that. Usually, this simply means planning a project, action, or investment that brings tangible progress towards meeting high-level business objectives.
Success in Step 1 is more likely when the proposal author has the skills to:
- Design and plan project, action, or investment outcomes that deliver measurable business value.
This usually means planning outcomes that are tangible progress towards meeting the organization's high-level business objectives. - Measure and quantify Business Value for both financial and nonfinancial outcomes.
This often means measuring progress toward nonfinancial targets, such as KPI improvements for such things as customer satisfaction, safety, risk reduction, branding, organizational image, readiness, and employee morale. - Measure proposal risks in quantitative terms.
The proposal writer must build confidence in financial specialists, stakeholders, and sponsors that the proposal minimizes risks and measures what remains.
Clearing the Hurdle Step 2
Ascertain Specifics of the Hurdle Rate Test


Step 2 shows hurdle participants exactly what they must achieve to win the event.
For Step 2, the proposal writer ascertains several hurdle test specifics. Whenever financial criteria help decide proposal fate, proposal authors need to know upfront the targets they must reach.
The writer can gauge proposal costs and benefits, roughly, even before finishing Step 1. Sometimes this information is an alert that plans in progress are heading for hurdle test failure. The sooner it is clear that a proposal is on a losing course, the easier it is to start over and re-design the proposal from the ground up.
In Step 2, the proposal writer benefits from ascertaining certain information on hurdle test specifics.
- Hurdle Rate Metric,
The specific calculation that will represent the proposal's "rate of return" in the hurdle test. The metric of choice is usually the Internal Rate of Return (IRR), but If not, the CFO will ask for another investment metric such as MIRR, ROI, ROA, ROE, ROCE, or Average Rate of Return.
Knowing which metric to compute also identifies the metric's input data needs. These will certainly include the proposal's cash flow forecasts. When the hurdle metric is IRR or ROI, the cash flow forecasts will suffice. Other possible metrics may also require items from the firm's Income Statement and Balance Sheet. - Risk Adjustment.
Decision makers sometimes add a "risk adjustment" to the designated passing hurdle rate score, especially for risky proposals.
- Investment Time Scope.
The "rate of return" concept and the metrics that stand in for it always refer to a specific time period as Investment Lifespan.
The time period in view may be as short as a few weeks (e.g., for investments in short-term trading securities or small engineering projects), or as long as several decades (e.g., for capital projects that deliver long-lasting assets such as ships or buildings).- For capital acquisitions, the period in view may be the asset's service life, or economic life, or depreciable life.
- For Capital projects that deliver long-lasting capital assets, the period will be the project life span plus the asset's life span (service life, economic life, or depreciable life).
- For Investments in Special Actions, such as initiatives or campaigns, the period in view is the life of the action.
- For Securities Investments, the investment lifespan is the length of time the firm expects to hold the investment. For long-term investments with an indefinite life, the firm may choose instead to use arbitrary timesapn, such as the first 3, 5, or 10 years of investment life.
- Target Hurdle Rate. The value that the proposal's metric must exceed to pass the hurdle rate test.
- Target Hurdle Rate.
The designated passing score on the chosen hurdle rate metric represents a judgement call by the CFO or other decision makers. The score may reflect their judgements on factors such as (1) Proposal risk, (2) the current cost of capital, (3) the current required return rate, or other considerations.
All of this information usually originates with the CFO, but the proposal writer should first try to ascertain these specifics directly from the individuals who pass judgment on the proposals. This may be the CFO, but it may also be a Budget Director, PMO officer, Validation Committee member, or the Chair of a Review Committee.
Read more on Step 2 hurdle test specifics in the following:
Clearing the Hurdle Step 3
Investment Proposal Costs for Two Scenarios
Step 3 finds and summarizes investment costs as cash outflows.
Hurdle rate metrics are essentially investment metrics. To play this role, IRR, ROI, and other metrics compare investment returns to investment costs. Each of these metrics makes the comparison in its own way.
Proposal writers aiming for the hurdle test must therefore complete Step 3 and Step 4. These steps summarize the cash flow values of investment costs (Step 3) and investment returns (Step 4).
Finding costs specifically due to the investment may require the writer to estimate investment period costs for two scenarios: (1) A proposal implementation scenario, and (2) a Baseline or Business as Usual Scenario.
Two scenarios are necessary when the same cost objects incur costs regardless of whether or not the firm implements the proposal.
To estimate investment costs, first ascertain the time scope, or life, of the investment (Step 2, above).
- For capital asset acquisition proposals, investment costs will cover the complete results of a total cost of ownership (TCO) analysis. These will include purchase cost, of course, but also the costs of selecting, ordering, financing, operating, maintaining, updating, and disposing of the asset, over the full asset life.
Finding costs due specifically to the acquisition may require comparison of separate TCO studies for (1) Proposal implementation, and (2) Business as Usual. Costs due only to the proposal action are the incremental differences costs between cost figures in the two scenarios. - For investments in projects, initiatives, or campaigns, the manager's planning details should include cost estimates for the life of the action.
Finding costs due specifically to these actions may also require comparison of separate TCO studies for two scenarios, Proposal implementation, and Business as Usual. - For investments in financial securities, investment costs include securities purchase, of course, but also any brokerage fees, financing costs, or interest fees that apply.
To prepare for the hurdle metric calculation, the proposal writer estimates the cash flow value of each period's total costs. The example below shows how to arrange these cost data for the hurdle test.
Example Cost Cash Flow Summary
The table below summarizes cost estimates for a proposal 4-Year marketing campaign, subject to a hurdle rate test before receiving funding. The task is to find investment costs due specifically to implementing the proposal.
The analyst must recognize, however, that the firm will incur costs and spend for the same five cost items in the table, with or without the campaign. As a result, the analyst produces 4-year cost estimates for two scenarios: (1) A Proposal implementation scenario, and (2) a Baseline, or "Business as Usual" Scenario. The analyst measures measure costs specifically due to the campaign as differences between line-item costs on the two scenarios.
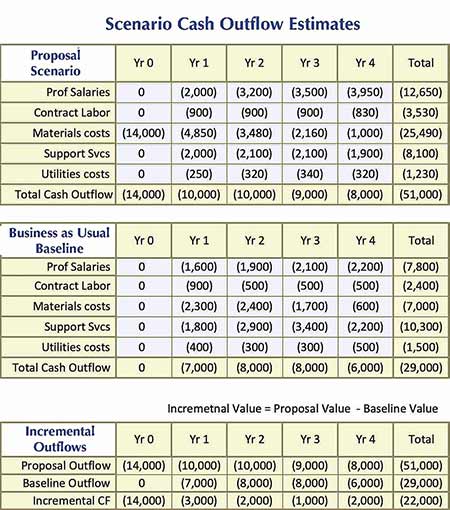
The Step 3 goal is to obtain the Net incremental cash outflow, for each year of the analysis period. The yearly results appear as Incremental CF in the bottom line of the third panel, the Incremental Outflows table. These figures enter the rate of return metric calculation (IRR calculation) in Step 5.
For more on Step 3 cost estimates, see:
Clearing the Hurdle Step 4
Project Proposal Cash Inflows and Benefits


Step 4 finds and summarize likely investment returns or gains as cash inflows.
Remember that the Step 3 goal was to measure and summarize investment costs. Step 4 now addresses the "Benefits" side of the cost/benefit analysis. Investment costs and returns have the spotlight in the hurdle rate test—and in the business case review that follows.
Step 4 requires this assumption:
Action for its own sake has little value for the organization. Actions that help reach business objectives do have business value.
With this assumption in mind, finding and measuring the value of returns becomes a matter of showing exactly where likely proposal outcomes contribute to meeting business objectives, and measuring the value of those contributions.
Begin Step 4 by listing the organization's targets for significant business objectives. These normally include both financial objectives and nonfinancial objectives.
- Financial Objectives.
Define and measure financial goals in financial terms, such as cash inflows, sales revenues, profits, or cost savings.
Designating a financial target in financial terms such as these automatically determines the metric to use for measuring progress towards the target. Analysts measure movement towards a cost savings goal in terms of cost savings improvements, for instance.
- Nonfinancial Objectives.
Define and measure nonfinancial targets in nonfinancial terms such as customer-satisfaction scores, quantifiable risk probabilities, or accident rates.
Nonfinancial objectives typically include targets on key performance indicators (KPIs) for qualities such as customer satisfaction, customer retention, market share, time-to-market, time-to-manufacturing, accident rates, brand loyalty, company image, military readiness, risk reduction, or the number of disciplinary actions.
When Analysts measure tangible progress towards nonfinancial targets in nonfinancial terms (e.g., KPIs), the task then is to find and assign financial value to the consequences of KPI changes.
Example Cash Flow Returns Summary
The table below summarizes returns for a proposal 4-Year marketing campaign, subject to a hurdle rate test before receiving funding. Cash flow cost estimates for the same proposal appear in Step 3, above.
The firm defines returns for this proposal as annual gross profits for the company's offerings in two product lines, Line A and Line B. The firm will sell and profit from both product lines, with or without the marketing campaign.
To measure returns due specifically to the campaign, the analyst forecasts gross profits from two scenarios. (1) Proposal Implementation, and (2) Baseline, or Business as Usual Scenario. In such cases, returns due specifically to the proposal are the differences between line-item profits on the Baseline and the Proposal scenarios.
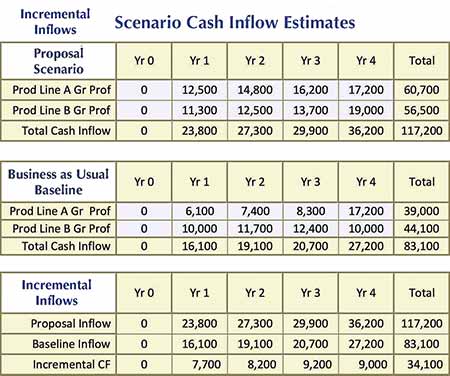
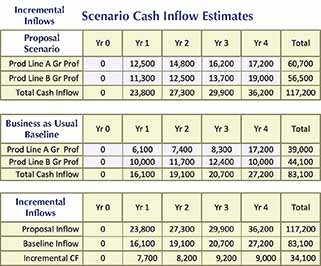
Step 4 develops the Net incremental cash inflow for each year of the analysis period. The yearly results appear as Incremental CF in the bottom line of the third panel, the "incremental (IRR calculation) in Steps 5 and 6.
See the following resources for more on measuring business benefit returns:
Clearing the Hurdle Rate Step 5
Calculate Inflows, Outflows, and Net Cash Flows


Step 5 prepares cash flow data for calculating the proposal rate of return in the hurdle test.
Remember:
- Step 3 summarizes proposal cost estimates as a series of cash outflows.
- Step 4 finds proposal returns, or gains, and values them in a series of cash inflows.
Step 5 now brings together the inflow and outflow data and organizes these figures as input for the hurdle metric that follows in Step 6.
To prepare data for the hurdle metric, the analyst refers to two items of information from Step 2:
- Step 2 ascertains the name of the financial metric that represents the proposal's rate of return in the hurdle test. The metric desgnated for this purpose is usually Internal Rate of Return (IRR). However, financial officers sometimes name other metrics for this role, such as simple Return on Investment (ROI).
Naming the metric tells the analyst which cash flow data to deliver in Steps 5 and 6. - Step 2 also identifies the investment lifespan and specific periods within that. The lifespan is usually a number of months or years, and the span periods are specific months or years.
Cash Flow Example 1: Single Scenario Case
When proposing investments in financial securities, the analyst forecasts cash inflows and outflows for only one scenario—the Proposal Scenario. Only one scenario is necessary because all of the investment costs and returns are clearly due specifically to the investment.
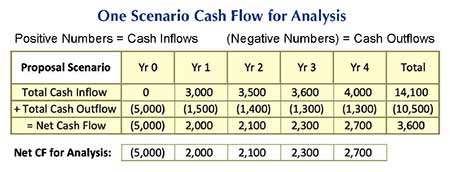
The table immediately below shows the data necessary for the IRR metric and also simple ROI.
- The IRR metric expects, as input, a net cash flow figure for each period, the table third line. Note that the cash flow for "Year 0," the immediate cash flow at the start of the investment life.
- The simple ROI metric expects, as input, separate cash inflow and outflow figures for each period. These cash flows appear in the table first and second lines.
Here, the analyst anticipates finding IRR for the proposal and therefore extracts the net cash flow figures, below, as Net CF Data for Analysis.

Cash Flow Example 2: Two Scenario Case
For analyzing projects, acquisitions, or other actions, with any form of investment cost/benefit or investment analysis, the analyst needs at least two sets of cash flow forecasts. Developing the data for IRR, ROI, NPV, or other investment metrics requires inflow and outflow estimates for a Proposal Implementation Scenario and a Baseline, or Business as Usual Scenario.
In these cases, the firm continues incurring costs and realizing returns from the same cost and benefit line items, whether it does or does not implement the proposal. The cash flow increments due specifically to the investment action are the difference between line-item costs on the two scenarios.
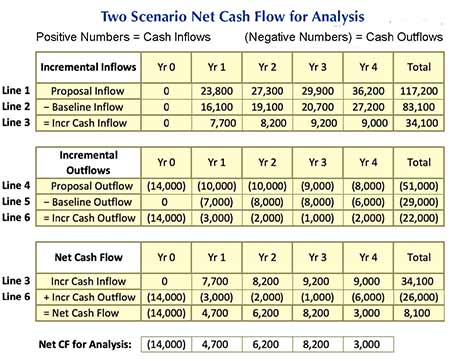
The table below presents cost and return cash flow estimates from examples in Step 3 and 4 above. The bottom panel below shows how these combine to produce incremental cash flow data for the hurdle metrics.
- Input data for the IRR metric are the Net Cash Flow figures in the bottom line of the third panel. Anticipating the IRR calculation, the analyst extracts these figures and presents them below the table as Net CF for Analysis, the investment metric.
- Input data for the ROI metric are the Incremental Cash Inflows and Incremental Cash Outflows in Lines 3 and 6.
For more on data and calculations for investment metrics, see the following:
See the following resources for more on measuring business benefit returns:
Clearing the Financial Hurdle Rate Step 6
Compute Hurdle Metric, Finish Competitive Event


Step 6 finds the rate of return forecast by the proposal and completes the hurdle event.
The hurdle test is, in principle, simple and straightforward. The proposal writer calculates the hurdle rate and then compares that to the target rate. When the metric exceeds the target rate, the proposal passes the test.
In reality, however, clearing the hurdle is only the beginning of the challenge facing the proposal writer. Often, proposal metrics clear the hurdle, but the analyst or author must then convince skeptical CFOs, budget directors, and review board members that the proposal rate of return is accurate.
In business everywhere, those seeking funding approval know in advance the passing score for the hurdle test. Very few show up for the test with a losing score in hand. In business today, most proposals that fail the test lose because financial officers and reviewers do not believe the proposal will deliver the returns it promises.
Those who submit funding proposals should always prepare to make a case for the reality of their hurdle metrics. Proposal authors should be ready to explain:
- Assumptions underlying cost and return estimates, such as assumptions about future business volume, costs, labor requirements, and an on-time finish.
- Credible evidence that Step 3 cost data include all relevant costs, but only relevant costs.
- Credible evidence that Step 4 returns (gains) will follow implementation.
- Transparent cash flow accounting for Proposal and Baseline Scenarios, and proof that input data for the rate of return metric are incremental cash flow data.
Example IRR Result For the Hurdle Rate Test
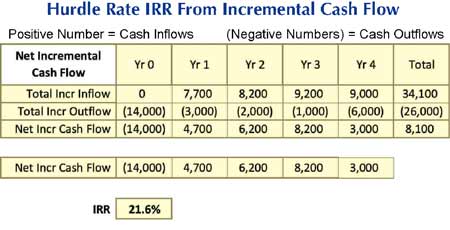
Hurdle event participants must usually appear for the test with an Internal Rate of Return (IRR) figure in hand. Examples in Steps 3, 4, and 5 show how to prepare cash flow data for finding IRR. The example below shows the IRR result from these data.
In this case, the analyst learns in Step 2 that the target hurdle rate for this proposal is 15.0% The actual proposal hurdle IRR of 21.6% clears the hurdle with percentage points to spare.
Before celebrating, of course, the analyst must be sure that the CFO, PMO officers, the Review Committee Chair, or anyone else refereeing this event accepts the IRR result.
Notes on "Computing" IRR
It is more accurate to say that analysts "find" IRR, rather than "calculate" IRR. The IRR metric has a mathematical definition that does not lead to a simple formula for solution.
IRR Definition: The internal rate of return is the interest rate for which the net present value of all proposal cash flows equals 0.
Analysts find the actual IRR value with a process that looks, at first, like "trial and error." More accurately, the process that leads to an IRR result is "Successive Approximation:" For this, the analyst or the spreadsheet calculates an NPV for a series of net cash flow figures, like those near the bottom of the table above. The process repeats over many trials, using a different discount rate each time. Trials repeat until a discount rate brings an NPV of 0. That rate is the IRR.
In practice, most people use a spreadsheet to handle the successive operations, out of sight, until an IRR result appears. In Microsoft Excel, for instance, a cell showing an IRR result holds a formula like this: "=IRR(B2:B:6,0.1)"
- B2:B6 is a spreadsheet range of five cells. Each holds a net cash flow figure. Together, cells hold the proposal cash flow stream.
- The 0.1 is an initial "guess" for the IRR. This guess merely serves as a starting point for approximation trials. Tests continue until it finds a rate that produces NPV=0. Trials continue until it finds a rate that produces NPV=0.
The spreadsheet finds this solution very quickly, even if it has to run hundreds of trials. For the spreadsheet user, IRR results seem to appear instantly.
For more resources on calculating and interpreting IRR, ROI, and other investment metrics, see the following resources:
See the following resources for more on measuring business benefit returns:

