When project failure is not an option, wise project managers rely on statistical process control to uncover hidden schedule risks, build teamwork, and guarantee on-time delivery.
Executive Summary
The Project Management Control Chart (Schmidt Chart) is a tool for tracking, reporting, and controlling the progress of time-critical projects. This project management tool distinguishes between minor schedule slips and problems that call for serious management intervention to restore the likelihood of an on-time finish. Project progress plots as actual project time used against the completed critical path percentage.
Control lines in the plotting space signal high or low probabilities of completing the project on schedule. When the Actual Progress line crosses a low probability control line, managers may decide to increase project effort and resources to bring it back on schedule. On the other hand, crossing a high probability control line means an early finish is very likely.
The progress plot is similar to statistical process control charts common in manufacturing settings. The plot puts current performance into an historical context that everyone involved with the project understands. It serves to focus discussion and real time feedback to the project team, project manager, and other managers.
Contents
- Executive Summary: Project Tracking With Statistical Process Control.
- Introduction to project progress control charting.
- Example project progress control chart (Schmidt Chart).
- Monitoring project progress and project completion.
- Estimating project task time means and variances.
- First analysis: Are you winning or losing project schedule control?
- Statistical control lines for early warning of schedule changes.
- Building and using the project progress schedule control chart.
Related Topic
- For complete introduction to the business case for a proposed project, see the article Business Case.
Project Management Resources
- The Excel-based tool, Project Progress Pro, provides an easy way to implement the project control chart appearing in this article. Project Progress Pro does not require a statistical background.
- For more on the project business case, with calculated examples, see the PDF ebook Business Case Essentials.
- Business Case Templates and other case-building tools for Project Management are available in the Master Analyst Shop.
Introduction to Project Control Charting
Process Control for Time-Critical Projects
This article presents a tool for monitoring, reporting, and controlling the progress of time-critical projects. The "progress chart" uses standard PERT network data to give project managers the kind of control usually associated with process control charting in manufacturing.
The progress chart provides:
- Simple visual tracking, comparing Actual Progress to the project plan.
- A clear distinction between minor deviations from plan and developments that call for intervention.
- An easy-to-interpret progress report for project team, project manager, and other managers.
- A simple way to compare different projects with respect to planning accuracy.
Projects That Must Finish on Time
During time-critical projects—developing new products for a competitive market, for instance—strong interest centers on the likelihood of finishing on schedule. Accurate information on progress relative to schedule may be crucial for scheduling IT resources, engineering work, manufacturing set up, product announcements, and customer shipments.
In fact, the on-time finish is often a high priority in many kinds of engineering and product development projects. This is because a late finish in these cases typically has serious economic consequences, and may impact the firms ability to compete.
Once a project is underway, however, it is not easy to read the probability of an on-time finish from PERT or GANNT charts. The progress chart, by contrast, shows these probabilities at a glance.
Keys to An On Time Finish
Research suggests that project teams are more likely to meet schedule goals when:
- Project managers, line managers, and high-level managers all participate in goal setting and scheduling.
- Managers use both formal and informal tracking methods.
- Managers provide timely and well-targeted responses to project progress problems.
- Groups collaborating on projects maintain a high level ofcommunication within and between groups.
On projects where the most critical project goals are schedule goals, the progress chart serves effectively to focus these activities.
Example Project Progress Chart (Schmidt Chart)
The example in Exhibit 1 below shows tracking of Actual Progress and Planned Progress for a completed project.
- The horizontal axis represents time since project start.
Original project scheduling calls for a project start at t0 and a finish at time tPC. Time tPC is the total critical path (CP) time from a task/event network such as a PERT chart. - The vertical axis represents project progress as a percentage of the CP (as explained below).
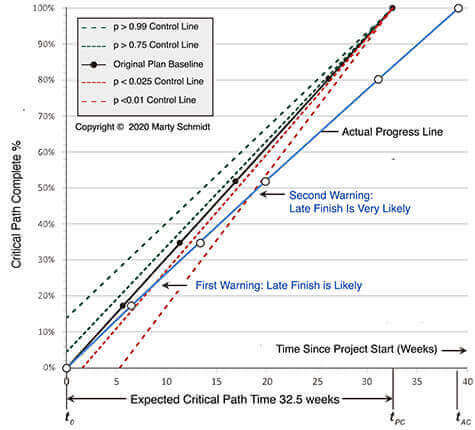
Had this project gone according to plan, the Actual Progress line would lie directly over the Original Plan baseline, reaching 100-percent completion at tPC, 32.5 weeks. Instead, actual finish time tAC was 39 weeks. Filled circles are critical path events in the plan, and open circles are actual event occurrences. Solid lines between circles show a continually increasing discrepancy between Actual Progress and project plan.
Control Lines Warn of Likely Late Finish
Control lines in Exhibit 1 warned of a likely late finish early in the project.
First Warning Week 8
The first warning came in week 8, when the Actual Progress line crossed the control line for probability p < 0.25. This was a signal that the project now had only a 0.25 chance of finishing at tPC of 32.5 weeks.
Second Warning Week 18
The second warning came in week 18, when the Actual Progress line crossed the p < 0.01 control line. This was a clear alert, just over halfway through planned project time, that the on-time finish probability was now only 0.01 or less. As a result, managers now had a strong message that they must now choose between two options: Either (a) simply expect a late finish, or (b) apply more resources to raise the probability of an on time finish.
What Can You See in the Actual Progress Line?
Note that all segments of the Actual Progress line slope lessthan the baseline. This means, therefore, that that project planners underestimated task times consistently. However, because the Actual Progress line is smooth, everyone can see that progress was relatively continuous and that the expected critical path was in fact the actual critical path.
This project very likely won approval and project funding with the support of a project business case analysis. Such a case weighs likely business costs and benefits from the project against likely results under other projects or under "business as usual" (not undertaking the project). And, an on-time finish was no doubt a key assumption in this case. Now, before committing more funds and resources to the project, management will probably ask for a new project business case, this time showing the consequences of a late finish.
Monitoring Progress
Moving Towards Project Completion
In business projects, no single metric adequately represents "project progress" for all purposes. Different progress measures might reflect the current percentage of:
- Design problems solved.
- Design phases (or stages) completed.
- Budgeted person/hours used.
- Allocated funds spent.
Other measures also work, however. If project finish date is a major concern, wecan represent the project with a single path, a series of consecutive non-overlapping tasks. In this case, current progress is always a point on the path. Exhibits 2 and 3 show how this path for the progress chart derives from PERT chart analysis. The progress chart measures project progress as the:
- Percentage of total critical path time used.
Example PERT Network With Critical Path for Progress Tracking
Exhibit 2 below is a top level PERT network for a product development project. Numbered circles are events and arrows are tasks leading from event to event.
- Starting event #1, for instance might be "Define Product Requirements."
- And, final event #15 might be "Begin Customer Shipment."
- Other top level CP events could be "Complete Logic Design Specs," "Verify Simulated Timing," "Assemble Prototype," and so on.
For complex projects, managers will also use lower level plans of activities and events that make up each task on the top level plan.
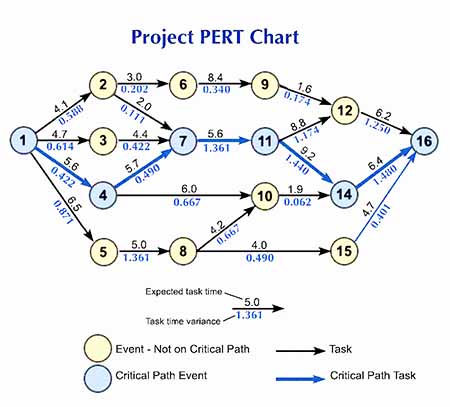
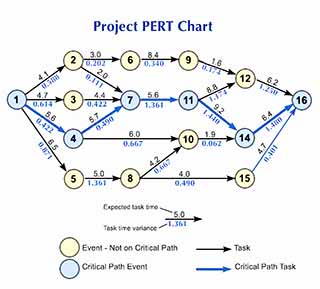
Progress measures for this project will focus on the critical path through this network, the path through events 1- 4 - 7 - 11 - 14 - 16.
Estimating Project Task Times
Calculating Task Time Means andVariances
Exhibit 2 above also shows the expected completion time and variance for each task, in weeks (variances are in parentheses). These come from standard PERT methods:
if ti,j is the task time from event i to event j, then the Expected task time, E( ti , j) and the estimated variance of the task time probability distribution σ2i,j are estimated as:
| Equation 1 | where | |
| Equation 2 |
These estimates (shortest, longest, and most likely task times) are the project manager's input data for the progress chart. They are the basis for measuring project progress and also for locating control lines, as in Exhibit 1. Conclusions about likely late or early finish depend on the validity of these three estimates.
Notation note: In the following sections, the symbol t always refers to a time point on the horizontal axis. The symbol does not refer to the small sample statistic t.
See the section Building and Using the Project Progress Chart for more on these estimates as input data for the chart.
Expected Task Times Are Not the Same as Most Likely Task Times
Statistical note: E( ti,j ),the expected time for task i, j, can differ from themost likely task time assumption m in the equations above.
- Firstly, expected task time E( ti, j) is the mean (μ) of a task time probability distribution. Equation 1 shows how E( ti, j) derives from a, b,and m.Secondly, the estimated most likely task time (m) is the modal task time value in that distribution.
In task 1,4 for instance, the product manager estimates a = 3.6, b = 7.5, and m = 5.6 weeks. As a result, the expected task time is 5.6 weeks and the variance is 0.422 weeks.
- Expected task times are the basis of the progress plot's Original Plan baseline.
- Task variances make possible control lines (following sections).
Basic Progress Measurement
Are You Winning or Losing Schedule Control?
For Exhibit 2, analysis of the expected task times reveals a 32.5-week CP linking events 1, 4, 7, 11, 14, and 16. Exhibit 3, below, shows the CP by itself with an E(ti,j) for each CP task along with a percentage showing the task contribution to the total CP. The progress chart framework starts with these data.


In the progress plot, horizontal axis segment t0 – tPC spans the total planned CP length. Here, 32.5 weeks = 100%. And, knowing total project duration, essentially defines the plotting space.
- The horizontal (time) axis runs at least from planned project start to finish, t0 to tPC.However, the analyst should extend the horizontal axis beyond tPC, to allow for a late finish.
- The vertical axis (% of CP completed) always runs from 0 to 100 percent.
- The Original Plan baseline (Planned Progress line) runs diagonally from lower left to upper right, from point (t0, 0 %) to point (tPC, 100%). Critical path events appear on this line as filled circles in Exhibit 1.
Actual project progress tracks by plotting points with these coordinates:
- The actual completion times of CP events, as total time after t0 (horizontal axis).
- And, the original CP percentages for those events (vertical axis).
Actual Progress event completion points are open circles in Exhibit 1.
Progress Chart Histories for Four Projects
Exhibits 4, 5, and 6 below show the progress chart histories of four projects. The charts reveal discrepancies between plans and actual finish times.

Exhibit 4 shows actual progress lines plotted for Projects A and B. For Project A, all segments of the Actual Progress (blue) line slope more steeply than the Original Plan baseline (black) line. All tasks finished under their planned times and the project was "on track" for an early finish from the start. By contrast, the Actual Progress line for Project B shows consistently underestimated task times. Project B, like the Exhibit 1 project, gave indications of a late finish from the start.

Exhibit 5 shows the actual progress line plotted for Project C. The Project C chart shows the effects of overestimating some task times and underestimating others. The extent to which the Actual Progress line deviates from or "hugs" the Original Plan line represents planning accuracy.

Exhibit 6 shows the actual progress line plotted for Project D. The Project D progress line shows what happens when tasks off the original critical path take longer than planned and therefore become CP tasks. This kind of planning problem results in horizontal line segments in the Actual Progress line. These are due to time gaps between the end of one original CP task and start of the next.
Control Lines Warn of Schedule Change Warning
Alerts When Early Finish or Late Finish Are Very Likely
The Original Plan and Actual Progress lines are descriptive statistics, easily calculated without reference to special statistical knowledge. And, for a given point on the CP, actual time used is simply compared to planned usage. Project managers can in fact plot and track these lines without a full PERT network. Project "phase transition points" or some other series of planned and actual event dates will suffice, as long as the sum of the segments equals planned project length.
The control power of the progress chart increases, however, if the analyst uses task time variances to make probability inferences about actual project completion time. As Exhibit 1 shows, these follow when Actual Progress crosses a control line. Crossing a control line means simply that the probability of finishing on time is changing.
Control Lines Are a Statistical Concept
Unfortunately, the explanation of statistical control lines is necessarily... statistical. The statistical theory is basic, but even that can deter those who are uncomfortable with the subject.At the same time, however, calculations for placing control lines on the progress chart are easy to apply by rote. This requires only a simple understanding of the three sentences in the previous paragraph.
Statistical theory is here for the sake of completeness.Those interested only in building and using the chart may wish to go directly to the practical guidance under Building and Using the Project Progress Schedule Control Chart.
Each control line represents a probability p,the probability of project finish on or before tPC. The analyst may in fact show control lines for any number of pvalues between 0.0 and 1.0. The chart is clearer, however, if it shows only a few, e.g., for p = 0.01, p = 0.25, p = 0.75, and p = 0.99.
Note that the Original Plan baseline is also the p = 0.50 control line. Actual Progress below baseline signals an on-time finish probability under 0.50. And, Actual Progress above baseline signals an on on-time finish probability over 0.50.
Assumptions and Equations for Placing Control Lines
Control line placement depends on several assumptions about project task times. Five assumptions in fact, underlie all control line methods. And, these five are usual in PERT analysis:
- Assumption 1:
Estimated Task times are independent. Actual time used for any task has no effect on estimated task time or variance of any other task.
- Assumption 2:
Task time probability distributions have means and variances given by Equations 1 and 2 above. - Assumption 3:
Probability distributions for the sums of individual task times are approximately normal (Gaussian) with means and variances as follows:
| Equation 3 | |
| Equation 4 |
Assumption 3 means that the Central Limit Theorem applies to sums of expected task times. And, this means the analyst needs no other assumptions about the shapes of individual task time probability distributions.
- Assumption 4:
Estimated finish time for the project is the sum of estimated critical path task times. This is because the Original Plan line shows each CP task ending where the next CP task starts. - Assumption 5:
During the project, estimates for each task's a, b, and mdo not change (estimated least possible time, longest possible time, and most likely time).
Crossing a Control Line is a Warning
When the Actual Progress line crosses a control line, e.g., the p= 0.25 line, the probability of completing the project by tPC or sooner is 0.25. This probability holds as long as the original a, b, and m estimates apply.
However, if the manager now deviates from the Original Plan—applying more resources than originally planned for a specific task, for instance—the original control line probabilities are not valid during that task. Should new control lines be drawn when resources are shifted, or when estimates a, b, and m otherwise changes?
- If the changes represent corrective actions for one CP task, to get the project "back on schedule," the original control lines should remain. They will apply again when the "unusual" task is completed.
- If instead, a, b, and m estimates change for several CP tasks, the manager should draw new control lines because the old ones will not be valid again.
And, if changes in a, b, and mduring the project alter the CP itself, the Original Plan line may stay in place, as far as it represents finished tasks, but a revised baseline can be drawn for remaining tasks to the new point (tPC, 100 percent).
Given Assumptions 1-5, we can choose one of several methods for plotting control lines. Consequently, to contrast methods 1, 2 and 3, each is illustrated with the data from the Exhibit 2 Project PERT chart.
Control Line Method 1
Critical Path Variances Proportional to task Length
The simplest approach to control line placement is method 1, the Proportional CP Variances method. Most users will use this approach most of the time, not only because it is simple, but also because the additional assumptions it requires are usually quite reasonable.
The Proportional CP Variances approach is valid if two more assumptions are valid:
- Assumption 6:
The likelihood of non CP tasks intruding on the CP is so small that we need consider only CP tasks when placing control lines. - Assumption 7:
Variances of individual task time probability distributions are proportional to task length. Individual task time variance estimates(which may or may not conform exactly to Assumption 7) are used only for estimating a variance for total project time. This variance is then "redistributed" among individual tasks as if Assumption 7 were true.
If Assumptions 6 and 7 are not tenable, then Control line method 1 is not tenable. And, in that case, the analyst should use method 2 or method 3 instead.
Example: Drawing Control Lines Under Method 1
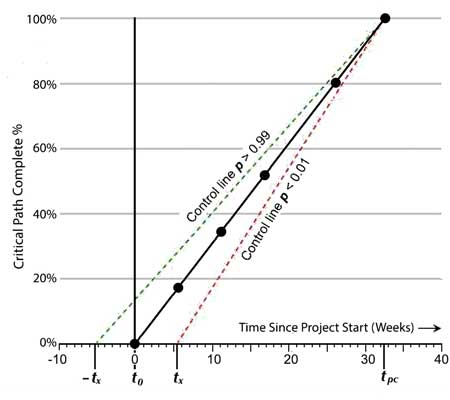
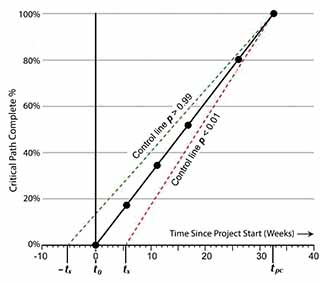
Exhibit 7 shows how to draw control lines under control line method 1, "Proportional CP Variances."
Formulas for Calculating Control Line Placement
Here, each control is a straight-line with the following end points:
Firstly, the control line begins on the horizontal (time) axis, at a point with coordinates:
- Horizontal axis point tX where x refers to a probability value.
- Vertical axis point 0 percent.
Secondly, all control lines in the chart end at the same point:
- Horizontal axis point , tPC, where PC refers to project plan finish time.
- Vertical axis point 100%.
For the control line at probability p = x, the value of tX is computes as
Equation 5 tX = zX √ σ2T
where
- zX is the horizontal axis value under a unit-normal distribution, above which proportion X of the distribution lies.
- σ2T is the sum of the all individual task variances (Equation 2), that is:
σ2T = Σ σ2i,,j for all tasks i,j on the critical path.
Note that zX values appear in unit-normal tables. And, alternatively, they are produced with calculator or spreadsheet functions that deliver a unit-normal z value given a probability. Unit-normal z values, of course, depend only on the probability requested. For probability x = 0.01, for instance, zX= 2.326 and for x = 0.25, zX = 0.675.
Example Control Line Placement Calculations
The value of σ2T follows entirely from the values of a and b that are estimated for each task on the CP (a = shortest possible task time, and b = longest possible time). Equation 2 above yields the variance in weeks for each task (individual σ2i , j). For the PERT network in Exhibit 2, the overall critical path variance in weeks is the sum of these:
σ2T = 0.422 + 0.490 + 1.361 +1.440 + 1.480
= 5.193
And, for probability x = 0.01:
tX = (2.326) √ 5.193
= 5.30 weeks
Similarly, for probability x = 0.25:
tX = (0.675) √ 5.193
= 1.54 weeks
Control lines for probabilities over 0.50 always lie above the Original Plan baseline, while control lines for probabilities under 0.50 always lie below the baseline. The horizontal axis coordinate of these is found, as Exhibit 7 suggests, by extending the axis to left of t0, where negative values represent an actual start before planned start at t0.
From the unit-normal distribution, all z values for control line p values greater than 0.50 will be negative. From the unit-normal distribution's symmetry, note the following:
Equation 6 t1.0 - X = – tX
Control Line Method 2
Individual Critical Path Variances
If task time variances are clearly not proportional to task lengths, Assumption 7 is not tenable.
- In this case, the analyst should therefore use control line method 2, instead, the method of "Individual critical path variances."
- However, the analyst should use control line method 3, instead, when both Assumption 7 and Assumption 6 are not tenable. Assumption 6 states that the likelihood of non CP tasks intruding on the CP is small.
A project manager would choose method 2, for instance when:
- The project plan and critical path include some tasks that will certainly have very small variances (task length is known with high confidence), while other CP tasks have quite large variances, unrelated to overall task length.
- And, Assumption 6 is tenable.
Method 2, the individual CP variance approach, requires Assumptions 1-6, and a new assumption:
- Assumption 8:
Probability distributions for individual tasks on the top-level PERT CP are approximately normal (Gaussian).
Assumption 8 is reasonable if each task on the top-level PERT represents the sum of a series of tasks from a lower-level PERT. Method 2 is identical to Method 1, except that method 2 finds a newtX at each Original Plan CP event. The total variance at each CP event is then the sum of the remaining task variances. Equation 4 applies at each CP event, except that σ2T in the equation now represents all remainingCP tasks.
Example: Control Line Placement Method 2, Individual CP Variances
Exhibit 6 shows the resulting progress chart with x = 0.01 and x = 0.99 control lines.

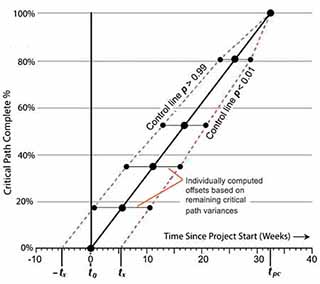
With the example data and x = 0.01, for instance, tX = 5.30 weeks at project start (as before). At the next CP event, 4, σ2T for the remaining CP is 5.193 – 0.422 = 4.771 and tX is therefore:
tX = (2.326) √ 4.77
= 5.07 weeks
The analyst finds tX in this way for each CP event through the next to the last (here, event 14); the control line is offset horizontally by this amount from each of these events.
Control Line Method 3
Risky Non-Critical Path Tasks
Engineering projects—especially those composed of several nearly independent sub-projects—are sometimes characterized by parallel and relatively independent activity paths which only meet at a few "nodal" events (such as "Prototype Assembled"). As long as Assumption 6 is tenable, however, critical path progress adequately represents progress for the whole project.
However, when task time variances are large relative to expected task times, and when one or more non CP paths have a large variance, the manager may want to recognize non CP risks in the progress chart. The next section shows an approach that makes this possible.
Focus on the Most Risky Tasks
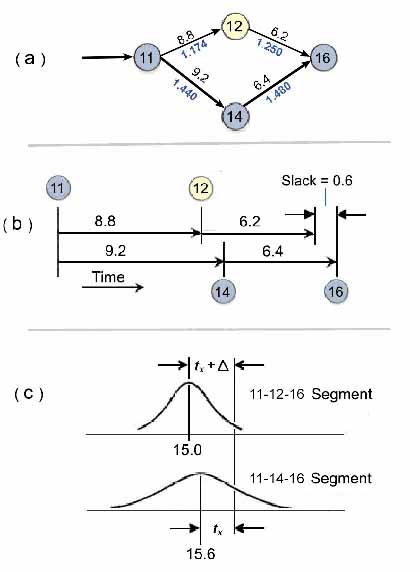
Unfortunately, calculating expected task lengths and risks so as to reflect the entire PERT network becomes a prohibitively complex and assumption-laden undertaking in networks with more than a few events. For progress plotting and control line purposes, however, it is usually satisfactory to apply basic probability rules so as to recognize just one or a very few especially risky non CP tasks. Exhibit 9 illustrates the approach.
Example: Control Line Placement Method 3.
Consider, for instance, the project plan portion in Exhibit 7(a), covering Exhibit 2 events 11, 12, 14, and 16. Here, the project CP links events 11, 14, and 16. The expected length of this CP segment is 9.2 + 6.4 = 15.6 weeks. Note that non CP path segment 11-12-16 is nearly as long: 8.8 + 6.2 = 15 weeks. The 0.6 week difference between path segments is essentially "slack" time for the 11-12-16 segment.
Consider also the standard deviations (σ) for each of these segments: both segments have task time σs that are large relative to the 0.6-week difference between paths:
σ of path 11-12-16 = √1.174 + 1.250 = 1.557 weeks
σ of path 11-14-16 = √1.440 + 1.480 = 1.709 weeks
Two factors suggest that control lines should reflect both path segments in Exhibit 7a:
- Firstly, the near critical nature of path 11-12-16.
- Secondly, the large size of these σ's relative to the slack in path 11-12-16
Assumptions and Equations for Method 3, Risky Non Critical Path Tasks
We may include the risk of path 11-12-16 entering the CP by invoking Assumptions 1-5, 8, and new assumption 9.
- Assumption 9:
Each non CP task that contributes to the progress chart will begin at the earliest possible time.
As the time lines in Fig. 7(b) suggest, Assumption 9 puts all the slack in segment 11-12-16 at the end of task 12. For each control line probability x, the analyst now findstX horizontal axis "offsets" from the Original Plan line for each event, 11, 12, and 14.
Consider the situation after event 11. Each control line probability x represents:
Equation 6 t1.0 - X = – tX
Equation 7 x = p [(Path 11-12-15 > 15.6) OR (Path 11-14-15 > 15.6)]
In general terms, if we let
A = the event (Path 11-12-16) > 15.6)
B = the event (Path 11-14-16) > 15.6)
then
p(A or B) = x, the control line probability.
Assuming that A and B are independent events (Assumption 1), probability theory gives:
Equation 8 x = p(A) + p(B) – p(A AND B)
where
p(A AND B) = p(A) p(B)
Equations for Task Time Probabilities: Risky Path Segments
Exhibit7(c) shows probability distributions for total task times in both path segments. The distribution for non CP path 11-12-16 has expected value μ1= 15.0 and σl = 1.557. The comparable distribution for CP path 11-14-16 has expected value μ2= 15.6 and σ2 = 1.709. From Assumptions 3 and 8, both distributions are f(z), the standard unit normal distribution:
Equation 9 f ( z) = ( 1 / √ 2π) e – ( t² / 2)
The total area under f (z) from z = – ∞ to z = + ∞ equals 1.0, and the probability that a value of random variable z falls within an interval on the z scale is the area under the curve, over that interval. In the 11-14-16 distribution,tX converts to a unit-normal z value as:
Equation 10 z2 = tX / σ2
In the 11-12-16 distribution, the same tX value uses a unit-normal z value given as
Equation 11 z1 = ( tX + Δ) / σ2
where Δ = μ1 – μ2 (i.e., slack in segment 11-12-16). Then, from Equation 8 and Assumptions 1–5, 8, and 9, a control line for probability x, at event 11, will offset horizontally from the Original Plan baseline by an amount tX where probability x is as follows:
Equation 12
Example Calculation: Risky Non CP Task Times
Given a control probability x, Equation 12 converts to a tX by Equation 10 or Equation 11. In practice, however, the fastest route to a solution may come from trial and error calculations, starting with proposed tX values and finding the associated Xs. Using the above method at event 11, tX for x = 0.01 is 1.75 weeks. This compares with a result of 3.97 weeks when path segment 11-12-16 is not considered.
Comparing Method 2 and Method 3 Control Lines
Exhibit 10, below, shows the p = 0.01 control line through a section of the progress chart plotting space, as method 3 prescribes. The same control line also appears as located by Method 2, in which the 0.01 control line ignores path 11-12-16.
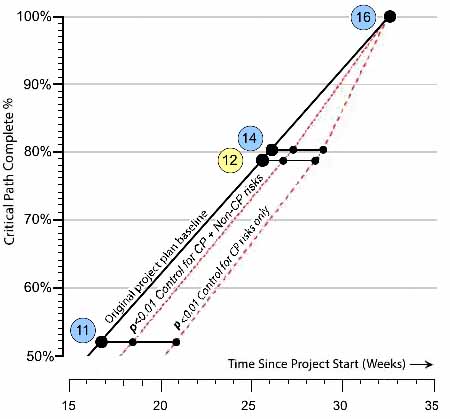

Note that the Original Plan line now shows planned completion of event 12, a non CP event, at 79.1 percent of the CP (where it would fall given an earliest possible start). Control line offsets tX are calculated at events 12 and 14 just as shown above, except that the means and variances of both probability distributions shrink appropriately
One conclusion from this demonstration of control line method 3 is that the presence of very risky non critical path tasks lowers the margin for error in project schedule planning, that is, the project manager is allowed less schedule "slippage" before the probability of an on-time finish drops substantially.
Building and Using the Schedule Control Chart
Practical steps
Progress charts are typically built for project control and reporting by those who create the original project plan. And, this is usually a project manager responsible for project planning, projectexecution, project outcomes, and securing project funding. This individual is usually the best prepared person to supply progress chart input data—task time estimates. Schmidt charts are also built and used, however, by those in Project Management Offices (PMOs) responsible for project portfolio management, business analysts in budget offices, Line Managers who supervise project managers, and others who have a stake in on-time project completion.
Statistical theory notwithstanding, the project progress schedule control chart (Schmidt chart) derives easily from a few simple data. Building the chart requires only:
- The project, described as path, a sequence of non overlapping tasks and task-end events. Examples above use CP tasks from a PERT network, but PERT analysis is not necessary for creating and using the progress chart.
- Estimates of task times for each path task. These include: The longest possible time (b), shortest possible time (a), and most likely time (m).
User Input: Task Time Estimates
Expected Values and Variances
Exhibit 9, below shows the project manager's original estimates for a, b, and m, for each CP task. These are the progress chart's user input. These input data appear in blue cells.
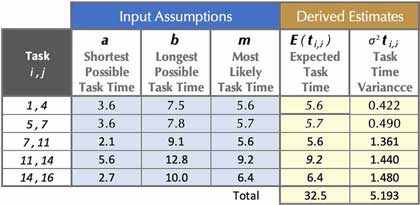
a: Shortest possible task time.
b: Longest possible task time and
m: Most likely task time.
From these values, the analyst derive an expected task time E( ti , j) and a task time variance (σ²i , j) for each task. These values appear in yellow cells above.

a: Shortest possible task time.
b: Longest possible task time and
m: Most likely task time.
From these values, the analyst derive an expected task time E( ti , j) and a task time variance (σ²i , j) for each task. These values appear in yellow cells above.
The expected times and variances from Exhibit 9 (yellow cells) then make possible create plotting data for the Original Plan baseline and control lines. For the blue cell data:
- Equation 1 produces an expected time E( ti , j) in each row from a, b, and m in that row.
- Equation 2 produces a variance σ²i , j in each row from a and b in that row.
Calculating Plotting Data
Plotting Points for Baseline and Statistical Control Lines
With expected times and variances in place, the rest of project progress chart plotting data derives as Exhibits 12A and 12B show. Note especially that Microsoft Excel plots the graphs in Exhibits 1 and 5 directly from data in Exhibits 10A and 10B, using Excel's scatter chart with straight-lines.
Exhibit 12A data serve as plotting coordinates for the Original Plan baseline and four control lines shown in Exhibits 1 and 5. Their vertical axis coordinates appear in Column (f):
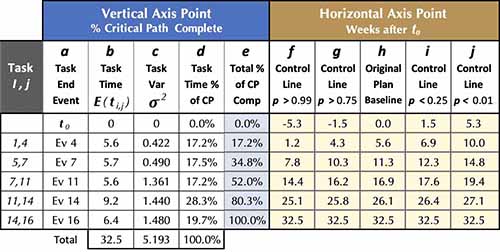
- The events and tasks in under "Tasks" and in Column b are simply names for horizontal axis plotting points.
- Columns b and c hold the expected task times and task time variances for each critical path task.
- Column d values are estimated task times from Column b, expressed as percentages of total critical path length.
- Column e (blue cells) holds vertical axis coordinates for all lines in the chart. These are cumulative totals of task time percentages in column d.
- Columns f - j, yellow cells, are the horizontal axis coordinates for plotting the Original Plan baseline and control lines,
The Original Plan Baseline plots from vertical axis coordinates in Column e and horizontal axis coordinates in Column h. The baseline Column h coordinates are the cumulative task times at each event, added from expected task times in Column c.
Finding Horizontal Axis Coordinates for Control lines
Column e has the vertical coordinates for all control lines. The horizontal coordinates for control lines derive in several different ways depending on which control line method is used: Method 1, 2, or 3. The simplest and most commonly used approach is Method 1, as illustrated in Table 2a and Exhibits 1 and 5. Under Method 1, each control line's horizontal position at any task i,j end is:
Horizontal position = Control line horizontal axis starting point
+ distance covered towards end point
For a control line at probability X, at the end of task i, j:
Equation 13
Horizontal position = zX
√ σ²T
+ (% CP Completed)(Total CP Length + tX)
where zX = Unit normal z where the probability of exceeding z is X
For control line probabilities used in this example,
z0.99 = –2.326 z0.75 = –0.675 z0.25 = 0.675 z0.01 = 2.326
σ²T=The sum of individual task variances (Column d total)
% CP Completed = Percentage of CP completed at end of task i, j from Column f.
Total CP Length = The sum of individual expected task times from Column c.
tX = zX
√ σ²T
Example calculations: Horizontal axis control line placement
Applying Equation 13 to the control line for p < 0.01 at the end of task 7,11 (Event 11), where 52.0% of the CP is completed (Column f), the horizontal axis coordinate of 19.44 weeks is:
Horiz. position = (2.326)(√5.193 ) + ((0.52)(32.5–(2.326)(√5.193 ))
= (2.326)(2.279) + (0.52)(32.5–5.301)
= 5.301 + 14.144
= 19.44
Examples in Exhibit 1 and Exhibits 10A and 10B represent control line charting under Control Line Method 1.
When assumptions about task time variances and non critical path tasks warrant the use of Control Line Methods 2 or 3, however, horizontal placements of some control line points may differ from those under Method 1. In these cases, the analyst finds control line horizontal placement at each task end as a horizontal offset from the Original Plan baseline, as Exhibits 6, 7 and 8 show.
Example User Input: Task Time Estimates, Expected Values, Variances
Actual project progress can be plotted, of course, only after project execution begins.
- For the Actual Progress line (as in Exhibit 1), vertical axis coordinates are the same as the corresponding vertical axis coordinates on the Original Plan baseline(from Column f of Exhibit 10 A above). These coordinates appear again in Exhibit 10B, below.
- Horizontal coordinates of the Actual Progress line are in blue cells of Column j in Exhibit 10B. Each is the total time since project start at t0 up to the task-ending event. Column i holds the actual time for each task. Total times in column j derive from the column i data.

Original IEEE Publication Data
This article first appeared as:
Title: Schedule Monitoring of Engineering Projects
Author: M. J. Schmidt
Subjects: Project tracking, project progress, project management.
As Part Of:

