What is Business Case Risk?
Business forecasts always come with uncertainty. You cannot eliminated uncertainty, but you can minimize risk and measure what remains.
It is no secret that future business forecasts always include some level of uncertainty. When business forecasts contribute to business case results, the inevitable uncertainty is business case risk. Everyone involved with the case knows that the analysts "most likely outcomes" may or may not materialize as the case predicts. Everyone with a stake in the business case has to ask: Will we really see these results?
Uncertainty is Unwelcome but Unavoidable
This kind of risk is especially unwelcome in the current business climate. Business leaders know well that the margin of tolerance for management error is shrinking, visibly. Decision makers are highly sensitive to watch words like "comfortable certainty," "accountability," and "due diligence." In brief, there is a new urgency today to answer questions like these:
- How do we know that we're going to see the forecast results? What are the chances of seeing "Worst Case" outcomes instead?
- Are we sure this is the best business decision?
- How can I prove, later, that I'm acting responsibly now?


Business case forecast results come with some level of risk and uncertainty. Risk analysis measures the likelihood of different outcomes, including best case, most likely, and worst-case scenarios. The risk analysis also shows how to minimize risk. [Photo: Silent film still, Risk and Reward, Las Vegas, 1924.]
IRR is All About a Cash Flow Stream
IRR analysis begins with a cash flow stream, a series of net cash flow results expected from the investment (or action, acquisition, or business case scenario). Consequently, cash flows for IRR analysis might look like the figure below. Note especially In the chart:
- Each bar represents the net of cash inflows and outflows for one two-month period.
- Positive values are net inflows, and negative values are net outflows.
Emphasize IRR Meaning and Interpretation
This article further explains and illustrates internal rate of return in context with related terms and concepts, emphasizing four themes:
- Firstly, IRR meaning and interpretation.
- Secondly, common misconceptions and misuses of IRR.
- Thirdly, comparing IRR to other financial metrics for cash flow analysis, including NPV, ROI, and Payback Period.
- Fourthly, presenting modified internal rate of return (MIRR) as an easy-to-understand alternative to IRR.
Contents
- What is a "business case risk?" Can you eliminate risk?
- How can business case risk be reduced, measured, and managed?
- Risk and Sensitivity Analysis: Think elementary
- Can you trust the business case?
- What are the next steps for understanding business case risk?
Related Topics Online
- See "Business Case Analysis" BCA for a complete introduction to BCA and the financial business case.
- "Business Case Proof" explains the rationale behind the BCA proof.
- "Return on Investment" explains ROI, NPV, IRR, Payback and other financial metrics.
- "Business Case Cash Flow" illustrates BCA cash flow estimates.
- For more on the IT Business Case, see" Accuracy and Credibility for the IT Business Case."
- For improving organizational case-building skills, see Business case-building competency.
Additional Resources for Managing Risk
- For more in-depth examples of risk measurement and reduction, see the PDF ebook, Business Case Essentials.
- For guidance on dynamic modeling for simulation-based risk and sensitivity analysis, see Financial Modeling Pro
- The 3-day professional seminar, Business Case Master Class, provides a practical introduction to risk and sensitivity analysis with Monte Carlo simulation.
Reducing, Measuring, and Managing Risk
Reducing uncertainty to a minimum and measuring what remains requires best practice cost and benefit estimates and quantitative risk and sensitivity analysis. Those are unlikely to be present, however, if the business case situation fits one of these "worst case" scenarios.
Worst-Case Approaches to Business Case Risk
Worst Case 1: The "Fund Me!" Request.
My business case was successful—I got my funding!
You have no doubt heard business people talk about previous business case work in such terms. Businesspeople write cases all the time to support funding requests, and that is as it should be. But there's an essential difference between cases designed to prove that funding is a good idea, on the one hand, and those designed to find out if funding is the right business decision on the other.
Compare the case to a scientific research project. Research scientists have their theories, and they often have a strong ego-involvement in seeing them proved correct. A good research experiment, however, is designed to test "theory," not prove it. Give your pet theory every chance to fail, try earnestly to make it fail, and give competing theories their best chance to prevail. If your idea still stands, so much the better. That's the only way to "prove" a theory with credibility.
Similarly, in business, support for funding will be credible if the business case shows in a compelling way that cost estimates are reasonable, that benefits are not overly optimistic, that significant risks are in view, and that other actions have been compared "fairly" with the requestor's proposal.
Worst Case 2: The Crystal Ball Syndrome
I have looked into the crystal ball, and I see $10M net gain if we implement my proposal.
The words may be slightly different each time, but that's almost the message that comes with many case results and recommendations.
Good business case analysis is not the output of a crystal ball or a "black box" predicting program, to be trusted and believed because the methodology comes with an impressive pedigree or a good track record. Instead of the crystal ball message, good business case results communicate this idea:
I have drawn several pictures of the way the future may work out. These are detailed and concrete scenarios, based on assumptions about many factors, each of which comes with some uncertainty (future prices, resource requirements, competitor actions, market growth, business volume, government actions, inflation, currency exchange rates, and many other things that are not certain).
However, if the assumptions I made "stand," these results will almost certainly follow.
All the uncertainty, in other words, should lie with assumptions underlying business case scenarios—not with how the case builder developed the cost/benefit estimates. And, the critical assumptions should be in plain view.
Can You Ever Be Truly Certain?
You can never be entirely sure about anything having to do with the future, including projected business results. However, assuming that your business case avoids both of the worst case problems above, there is a level of certainty just below "absolute" that business case builders can aim for and case users can expect.
We can be very, very sure (say, 99% certain, or 90% sure), that an action or decision will bring business results within a given range. And, if that range is too broad for comfort, there are steps you can take to narrow the scope—if you're willing to put more resources into the business case project. That range is called a confidence interval (described below).
Risk and Sensitivity Analysis
The Underlying Principles are Simple
Questions about certainty in a business call for quantitative risk analysis. "Good," by the way, does not have to mean "advanced" or "inaccessible to ordinary business people."
The kind of certainty claimed here comes from the world of elementary statistics. To learn and use what follows you will need a few probability terms from the basic introductory statistics course, the one for "non-statistical people." You will not need to go beyond that. Some of the leading risk analysis software tools come with excellent user guides that do not even assume that much background.
The purpose here is not to teach risk analysis, but rather to give some sense of what it can do. For a complete introduction to applied risk and sensitivity analysis, see Business Case Essentials.
Risk Question 1
Will We See These Results?
The business case for entering a new product market projects a net gain of $590,000 over the next five years. Everyone knows, however, that the real result will not be $590 thousand, exactly: it will be something more or something less. But can the business case builder say anything more about the likelihood of other results? Here is one kind of response to that question.


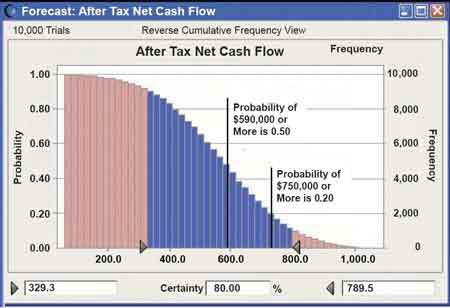
This graph shows the chances of reaching or exceeding different net gain figures. It shows the results of a simulation exercise with the same financial model that produced the initial $590,000 estimate. Instead of showing just the most likely outcome, however, it says that the probability of realizing at least $329,000 is around 90%, while the chance of seeing $750,000 in gains, or more, is about 20%.
Moreover, the 80% confidence interval (dark blue area under the curve) says they can be 80% confident that the actual results will be between $329 and $789 thousand. This kind of answer may provide the "comfortable certainty" decision-makers need If they trust these results (see below). If the new product venture must bring gains of at least $300,000 or more to be worthwhile, decision-makers might be quite ready to act on a 90% probability. If they must have $750,000 or more, this proposal does not look like a wise decision.
Risk Question 2
Which is the Better Business Decision?
Management has two competing proposals on the table, each for a different product launch. One comes with a business case projecting a net gain of $590,000 across five years. The other looks forward to an expected five-year profit of $800 thousand. The company can only afford to invest in one of these initiatives. Which one should they choose?
Decision makers will weigh the proposals against each other in several ways, considering strategic fit, the competition, economic trends, market trends, and other factors no doubt. When the overriding concern is "return on investment," however, decision-makers may approach "comfortably certainty" with another kind of statistical guidance based on the same simulation exercise:


Proposal A has a lower expected value (most likely result), but it comes with a much narrower confidence interval. If management chooses proposal B, they have an 80% level of confidence that the actual result will be somewhere between $329 and $789 thousand. The difference between these numbers is the range of "uncertainty," about $462 thousand.
By contrast, the proposal B comes with a higher expected value but a much higher range of uncertainty. Here, the 80% level of confidence stretches across $1,139 thousand of possible results (that is, $251 through $1,139 thousand).
Assuming they believe these results decision-makers may take the narrower confidence interval as the comfortable certainty, which they need to act.
Risk Question 3
Can I Prove That I Am Acting Responsibly?
Accountability is becoming the watchword for decisions in project management, capital spending, policy changes, and other commitments of all kinds. Indeed, accountability angst may be the only way to explain why so many people start a financial justification business case, even though the decision is already over, and the money already spent. Many ask "Can the business case prove that I'm making a solid, responsible decision? Where does the proof come from?"
Accountability in the future comes from the same steps that establish trust and belief in case results today. We have seen above the kind of "certainty" that good business case results can claim. Results like those in Questions "2" and "3" above are useful—to those who believe them. But can anyone accept the claims? How far can you trust statistical results?
The key to deciding "on trust" lies in understanding the assumptions behind the cost and benefit estimates. Remember those good business projections should not be viewed as the output of a "black box" predicting system or a high-powered analysis that very few people understand. Ideally, the case builder wants to position business case results as described above. It is worth repeating the case "positioning" that case builders should aim for:
I have drawn several pictures of the way the future may work out. These are detailed and concrete scenarios, based on assumptions about many factors, each of which comes with some uncertainty. However, if the assumptions stand, these results indeed follow.
Whether or not we trust the projections depends on what we know and believe about the assumptions. Below is a simple example, using a single cost item estimate and three assumptions. The approach is the same, however, when analyzing a full cost/benefit cash flow statement from the case.
Can You Trust Business Case Results?
Management in a network services company is deciding whether or not to launch a new customer service offering. They will go forward with the service only if they are confident it will be profitable. This confidence rests on a decision-support business case, with a large number of estimated cost and benefit items.
Here is their approach for estimating one cost item, "annual labor costs," for service delivery. The estimate relies on just three assumptions.


The average values are the most likely values in the eyes of case builders using the expected averages:
Annual labor cost estimate
= The on site time * Labor rate
= 12 * 100 * 4.00 * $80
= $384,000
The road from assumption to cost estimate is out in the open for all to see and evaluate. If the assumed values turn out exactly at the averages given, no doubt about it, the annual cost of labor will be $384,000.
Should management trust that estimate? Remember, these decision-makers are highly risk-averse. They will go forward only if they have confidence in the projections. If the cost of labor turns out to be more than $500,000 the service becomes unprofitable. How likely is that?
Run the future 10,000 times
Risk analysis addresses such questions by applying Monte Carlo simulation1 to a financial model. In this case, the "financial model" is just the formula above.
Notice first the ranges of possible values for each assumption: the case builder expects an average monthly call rate of 100 calls, but in fact, the number could be more or less. However, the case builder is very sure that it will not be less than 70 or more than 135. The other assumptions also can and probably will differ from the expected value, but the case builder is very sure they will fall within the ranges given.
With the assumptions viewed as ranges of possibilities, and with a few more assumptions about the likelihood of different assumption values2 we can use Monte Carlo simulation to "run the future" 10,000 times and summarize the various cost estimates that appear. Here is what the case builders found with their first-pass simulation run3:


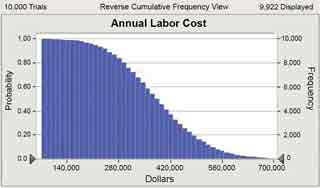
Cost results risk probabilities from Monte Carlo simulation. The graph shows the possibility of reaching or exceeding total cost figures.
There is a 50% probability of seeing an actual cost of $384,000 or more. That's no surprise: we already knew the expected average. But these risk-averse decision-makers are more than a little uncomfortable with a 20% chance of having actual costs hit $500,000 or more. Moreover, the 90% confidence interval for the cost estimate is very wide: $240,000 through $530,000.
Removing Uncertainty
Can they do anything to build confidence in seeing that labor costs stay low enough to make the service profitable? Analysts look for guidance from another result of the simulation exercise, sensitivity analysis.


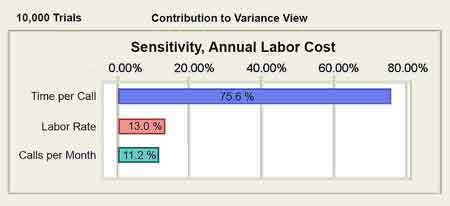
While performing the risk analysis, the simulation program was also keeping track of the correlation between each assumption and the forecast result (here, the cost figure). This chart tells us that the dominant "assumption," by far, in controlling different cost results, is the assumption about time spent per service call.
If case builders can reduce the uncertainty in the "time per call" assumption, they can reduce the uncertainty in the projected cost. Here, analysts chose to lower uncertainty in this assumption by reducing the range of values in the range. After more discussions with the service product manager and the service personnel training manager, the analysts narrowed the range of "near certain" average on site time requirements from 1-7 hours to 3-5 hours. Very occasionally there may be a much longer or much shorter on site call time, but they are very sure now that the average on site time will be in the narrower range, 3-5 hours.
Case builders also reduced the range of estimates for "average labor rate" from $60-$100/Hr to a much narrower range of $75-$85 per hour. Once they became sure now that the assumptions will fall in the smaller scope, the case builders re-ran the simulation program and produced this result:
The most likely outcome still $384,000, but now the probability of an actual cost of $500,000 or more is virtually zero if you can believe the new assumptions about the assumptions!
Furthermore, the management can be 90% confident that the actual cost figure will fall between $344,000 and $422,000. If the management trusts that prediction, the firm is ready to implement the service.
Should You Trust These Results?
The question of trust all comes down to what you believe about your assumptions. If the (now narrower) ranges of possibilities for the assumptions stand, then the probabilities in the final summary graph can be trusted.
Next Steps for Understanding Business Case Risk
For a practical introduction to applied risk and sensitivity analysis, as shown on this page, see Business Case Essentials. For guidance in building a dynamic financial model for your case for simulation-based risk and sensitivity analysis, see Financial Modeling Pro.
___________________
Footnotes
1. This approach is called Monte Carlo simulation because it uses probabilities the same rules that operate on the gaming tables in the Grand Casino in Monaco. The illustration in the example is from a Monte Carlo simulation program, "Crystal Ball"® from Oracle, Inc.
2. This illustration does not show the likelihood that assumptions take on different values, but the approach appears in Business Case Essentials and our other books, as well as the documentation and online help that comes with the leading Monte Carlo simulation programs, such as Crystal Ball.
3. The simulation program chooses a new set of assumption values, based entirely on what we have just told it about the assumptions, looks at the cost estimate that results, and then repeats the process thousands of times.

