Business Case Results Begin With Cash Flow
Cash flow figures are the basic data in the financial business case. From them, BCA builds cash flow metrics, financial forecasts, and business case proof.
Businesspeople turn to business case analysis (BCA) seeking two kinds of information:
- First, business case results can provide trustworthy forecasts of the business costs, benefits, and risks that are likely to result from an action or decision,
- Second, BCA results can prove with a high level of certainty that one future action is a better business decision than other possible actions.
BCA analysts develop both kinds of information from the basic core financial information in the case results, the business case cash flow statements.
Define Business Case Cash Flow Statement
The business case analysis aims to predict future business outcomes under one or more scenarios—usually one scenario for each possible action, decision, or investment under consideration.
- The BCA forecasts likely future cash inflows and outflows for each cost or benefit item in each scenario.
- The analyst structures a Business Case Cash Flow statement for each scenario, to summarize inflow/outflow forecasts for the scenario.
The BC cash flow statements serve to provide input data for calculating financial metrics and formal risk and sensitivity analysis.
This article explains how case builders analyze cash flow data to produce financial metrics (such as NPV, IRR, and ROI), financial forecasts for different action scenarios, and business case proof that a recommended action is the better business decision.
Notice, incidentally, that business people often refer to moving water as a metaphor for moving cash. Cash payments into or out of a firm are cash inflows or outflows. A series of cash flow events is a cash flow stream. A business can pour funding into a costly project and drain the pool of working capital. Assets that can turn quickly into cash are liquid assets.


Explaining Cash Flow Statements in the Context of Business Case Analysis
Sections below further explain and illustrate the role of cash flow statements in the context of business case forecasting, business case scenarios, and business case proof.
Contents
- What is a business case cash flow statement?
- Simple example business case cash flow statements:
- Incremental cash flow statements: Showing what changes with an action?
- Cash flow analysis and proof: Scenario comparisons prove the case.
- Business case vs. financial accounting CF statements.
- Cash flow statement structures.
- Requirements for building the cash flow statements
Related Topics
- For an in-dept introduction to cash flow management and cash flow analysis, see Cash Flow.
- For more instead on cash flow statements in financial accounting, see Statement of Changes in Financial Position.
- See Business Case for a complete introduction to business case structure and content.
- For more instead on nonfinancial costs and benefits in the business case, see the articles Business Benefits and its coverage of Key Performance Indicators.
- For more in-depth coverage of business case cash flow statement content and structure, and examples see the ebooks Business Case Guide or Business Case Essentials.
Simple Example Business Case Cash Flow Statements
Business case analysis normally addresses questions such as these:
- Is there financial justification for the proposal asset purchase?
- If we implement the proposal initiative, what are the funding requirements for our capital budget? For our operating budget?
- Which of the investment proposals is the most promising? Which is least risky?
- Which course of action represents the better business decision?
The analysis attempts to answer questions like these by predicting future business outcomes under one or more scenarios.
The case includes one scenario for each possible action, decision, or
investment under consideration. The analyst recommends action after analyzing and comparing the scenario cash-flow statement.
Exhibit 1 presents examples of the business case cash flow statements for a case with two possible action scenarios. Exhibit 1 also includes an incremental cash flow statement showing, item by item, the difference between the Proposal scenario (Scenario 1) and the Business as Usual Scenario (scenario 2).
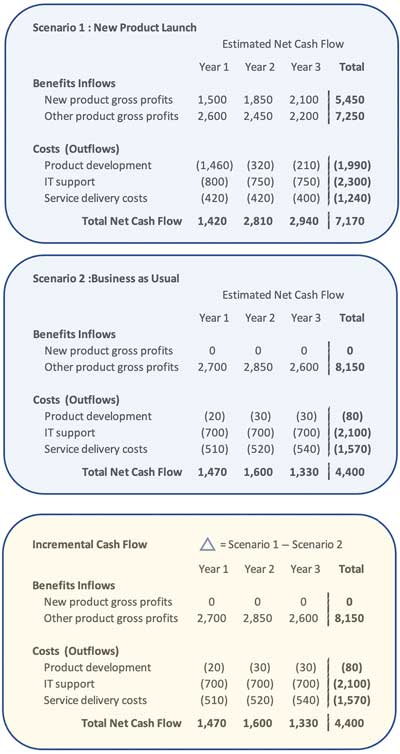
Exhibit 1. Cash flow statements for a case with two scenarios. Management will choose one of these scenarios for implementation. The incremental cash flow statement (bottom panel) shows expected cash flow changes, if the Proposal scenario (Scenario 1) is implemented instead of running Business as Usual (Scenario 2).
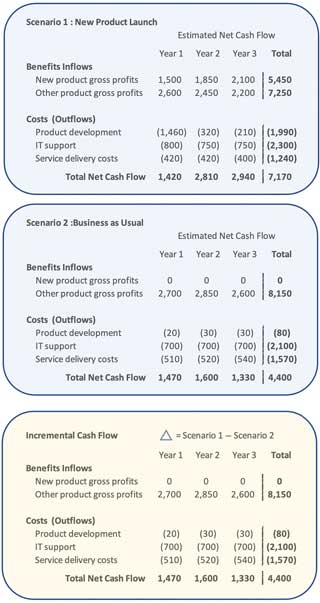
Exhibit 1. Cash flow statements for a case with two scenarios. Management will choose one of these scenarios for implementation. The incremental cash flow statement (bottom panel) shows expected cash flow changes, if the Proposal scenario (Scenario 1) is implemented instead of running Business as Usual (Scenario 2).
This case analyzes two possible action scenarios. One scenario (Proposal Scenario, upper panel) represents a new product launch. The other scenario (middle panel) represents "Business as Usual" that is, continuing business without launching a new product.
The analyst predicts cash inflows for two Benefit items in each scenario, "New product gross profit" and "Other product gross profit." There is a cash inflow estimate for each year of the period in view. These figures are inflows, not outflows, because they appear as positive numbers.
The analyst also predicts cash outflows for three Cost items, which appear on the full-value statements as negative numbers (parentheses indicate negative numbers in).
The upper two panels are full-value cash flow scenarios, to distinguish them from the bottom statement, the incremental cash flow statement (the following section further describes incremental statements. Full-value means simply that each cash inflow or outflow figure is its full value: a full-value outflow estimate of $510 means simply that $510 is the size estimate of the outflow.
Note that both scenarios have the same benefit and cost line items, even though one scenario (Business as Usual) anticipates 0 cash inflow for all years of the analysis on one item (New product gross profits). Matching cost and benefit items for all scenarios in this way ensures that comparisons between scenarios are fair and objective. Matching scenario line items this way also makes it possible to create an incremental cash flow statement (next section).
Which scenario should the analyst recommend? The analyst must analyze further before answering, but notice from the upper two panels that three-year net cash flow is greater under the Proposal Scenario (7,170) than it is under Business as Usual (4,400).
Note that full-value data of this kind are essential for budgeting and planning purposes. For decision support purposes, however, decision-makers turn to the incremental statement.
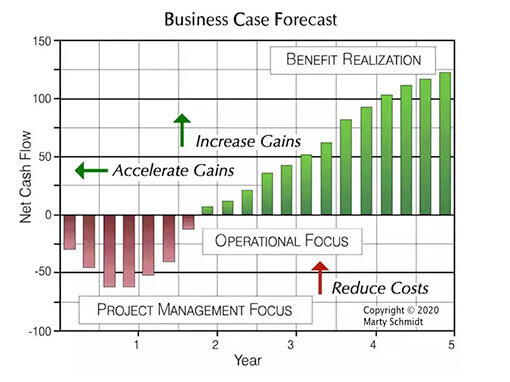
Exhibit 2 below shows summarize case case flow results in graphical form.

The Incremental Cash Flow Statement
Showing What Changes Following an Action
To choose which scenario to implement (Business as Usual or Proposal), decision-makers could compare one full-value statement against the other. To make that kind of decision, however, the primary challenge is understanding how the two full-value statements differ. It is hard to identify and measure differences between scenarios, from only a side-by-side display of two full-value statements.
To bring out the differences between scenarios, the analyst builds an incremental cash flow statement such as the one at the bottom of Exhibit 1 above, using the approach in Exhibit 3, below.
The incremental statement shows only "what changes" after implementing the proposal scenario. This statement compares Proposal full-value figures with the corresponding figures on the Business as Usual full-value statement, simply and directly. For this reason, decision-makers will focus on the incremental statement when deciding which scenario to implement. The incremental statement in the example shows only the gain and
loss increments that follow from implementing a product launch.
It might appear at first that the incremental statement has the same set of line items as the full-value versions. However, look closer and you can see that the line item names signal that they represent incremental data. The signal lies in the use of relative terms such as "increase," "decrease," and "savings."
Notice also that the
item "Service delivery cost..." now appears under "Incremental Benefits"
instead of a cost category, and the item "Other product gross profit"
is now under "Incremental Costs" but not "Benefits." The reason these
items change categories isappears below.


Calculating Incremental Cash Flow
The analyst computes Incremental cash flows directly from the full-value figures by subtracting Business as Usual values from their corresponding Proposal Scenario. That is, each incremental value, or Δ (delta) is:
Δ i , j = Proposal scenario cash flow i , j – Business as Usual cash flow i , j
Where Δi , j is the incremental cash flow for line item i in year j.
Full-value cash flow figures in the previous section use a sign convention:
- Cash inflows are positive values.
- Cash outflows have negative values.
This convention for the full-value data helps ensure that sure that incremental values have the correct sign. A positive increment means that inflows increase, and a negative incremental value means that outflows increase.
Consider, for instance, the Year 2012 incremental value for "New product gross profit." For the Proposal Scenario, the value is 1,500, while the value under Business as Usual is 0. The incremental value is:
Δ = 1,500 − 0
= 1,500
New product cash flow increases 1,500 in 2012. Subtracting a positive number or 0 from a larger positive number yields a positive number.
Similarly, consider the 2012 incremental value for the cost item "IT support." The full-value IT support cost is a cash outflow under both scenarios, but the −800 Proposal Scenario outflow is larger than the Business as Usual outflow of −700.
Δ = (− 800) − (−700)
= −100
IT
support costs (outflows) increase by 100 during 2012. Taking a smaller
negative number away from a higher negative number yields a
negative result.
The most interesting incremental results occur when they reveal cost savings or avoided costs. Consider the line item "Service delivery costs" for the year 2012. Service delivery costs are non zero under both scenarios. Under the Proposal Scenario they are 420, but under Business as Usual they are larger (510). Here, the incremental result will be a positive number.
Δ = (− 420) − (−510)
= 90
A
larger negative number subtracted from a smaller negative number yields
a positive number result. This mathematical twist is the mechanism by
which business case analysts identify and measure cost savings and avoided costs for the
case (next section).
Finding Cost Savings and Avoided Costs
Some people are unsure how to show in the business case that a proposal action leads to cost savings, or avoided costs. A cost savings seems like a "benefit," but it has to do with "costs." They ask: How do I find, measure, and present cost savings in my business case?
Remember that savings is a relative term. One cannot find or measure savings without a baseline. In the business case, the Business as Usual scenario provides baseline data. All savings and avoided costs have meaning only relative to the baseline.
In the example full-value cash flow statements above, for instance, "Service delivery costs" estimates have cash outflows of 420, 420, and 400, across three years, in the Proposal scenario. However, estimates for the same costs for the same years are 510, 520, and 540 under Business as Usual. Thus the proposal scenario shows a cost savings of 90, 100, and 140 for these years.
The incremental cash flow statement captures these savings as positive cash flows, and labels them as "Service delivery cost savings" under "Incremental Benefits." On the full-value statements, "Service delivery costs" are "Costs" because they are cash outflows on both (full-value) statements. The "Service delivery" item moves the "Benefits" category on the incremental statement.
It is also quite possible to discover avoided costs on the incremental statement. An avoided cost has the same mathematical properties as a cost savings, except that the term avoided cost refers to costs that have not yet occurred, but which certainly will occur under Business as Usual.
Preventative health care and preventative maintenance are familiar examples of activities meant to create avoided costs: changing oil on the automobile at prescribed intervals, for instance, leads to an avoided cost for replacing an engine, which would certainly come under "Business as Usual" (that is, making no oil changes).
Some
finance professionals resist allowing avoided costs into a
business case, probably because the future costs to avoid have not
occurred yet, or possibly for other reasons. Nevertheless, if the
analyst argues credibly that a cost is coming under "Business as Usual" and also show credibly that the cost is not coming with a proposed action, the avoided cost is a legitimate incremental cash inflow and benefit for the business case.
Incremental Costs From Benefit Items
You may notice one final result on the incremental cash flow statement involving another line item that changed categories, moving this time from "Benefit" to "Incremental Cost" categories. The item here is "Other product gross profit" which is less each year under the "Proposal Scenario" than under "Business as Usual."
The
cash flow statements show that this company will give up some profits
for existing products ("Other products"), in exchange for a much larger
incremental gain with "New product gross profit. However, the decrease
in Other products gross profit" scores as an "Incremental Cost" on the
incremental statement.
Multiple Proposal Scenarios and Incremental Cash Flow Statements
The
examples above present a business case with two action
scenarios, where one is the baseline or "Business as Usual" and the
other a "Proposal." Know to two full-value scenarios call
for one incremental cash flow statement. Very often, however, several
different possible actions are in view, and the business
case has two, three, four or more "Proposal" scenarios. Exhibit 4 shows the general approach for building incremental statements in such cases.
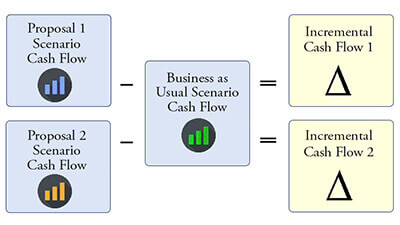
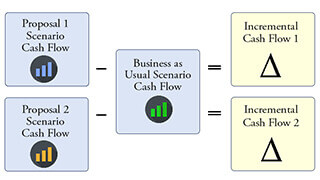
Exhibit 4.Incremental cash flows for two proposal scenarios, where both are compared to the same Business as Usual scenario
When there is more than one proposal scenario, how many "Business as Usual" and how many incremental cash flow statements must the analyst producer?The good news is that the case builder needs only one "Business as Usual" scenario, no matter how many "Proposal" scenarios appear in the case. As Exhibit 4 suggests, each full-value proposal scenario relates to its own incremental cash flow statement. All incremental statements use the same Business as Usual statement as a baseline.
- One Proposal scenario and one Business as Usual scenario call for three cash flow statements: Two full-value statements and one incremental statement.
- Two Proposal scenarios and one Business as Usual scenario call for five statements (as in Exhibit 3): Three full-value statements and two incremental statements.
Cash Flow Analysis for Proving the Case
Scenario Comparisons Make the Case
Which scenario should the analyst recommend for action? Exhibit 5 shows the net cash flow forecasts for each scenario here. The full-value cash flow statements in Exhibit 1 provide the graphing data for Exhibit 5 below.
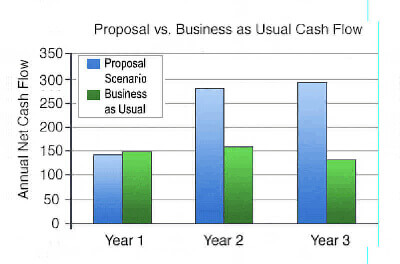
Net Cash Flow
Cash flow analysis begins with the full-value cash flow statements for the two scenarios. Exhibit 4 reveals larger three-year net cash flow for the Proposal Scenario then for Business as Usual:
- Three-year net cash flow, Proposal Scenario: 7,140
- Three-year net cash flow, Business as Usual Scenario: 4,400
That much is a point in favor of recommending the Proposal. Further analysis for the comparison, however, will focus on the incremental cash flow statement. The incremental cash flow data make possible the use of investment metrics, including Return on Investment (ROI), Payback Period, and Internal Rate of Return.
Return on Investment (ROI)
Simple Return on Investment when comparing the Proposal Scenario with Business as Usual is large:
ROI = (Gains – Investment cost) / Investment Cost
= (5,780 – 2310) / 2310
= 150.2%
The HIGH ROI result is a point in favor of undertaking the action.
Net Present Value for Incremental Cash Flow
The analyst finds Net Present Value (NPV) for the Proposal incremental cash flow as follows: NPV = ∑ FVj / (1+ i )n for j= 0 to n
where
FVj for each yearly period j = Net Cash Flo for the period
Discount rate i = 8.0% ( or 0.08) for this example
Period j = 0 (now) through 3 (Year 3)
NPV= –50 / (1+.08)1 + 1,560 / (1+.08)2 + 1,960 / (1+.08)3
= 3,213
Whether or not this is a strong point in favor of undertaking the action depends on what the analyst finds for NPV from incremental cash flow statements for alternative uses of the same funds. Compared to Business as Usual, however, this is a high positive result.
Payback Period
Using
the incremental cash flow for the Proposal Scenario this action "pays for itself" in 1.03 years. Whether
or not this is a strong point in favor of undertaking the action
depends on the Payback Period from potential alternative uses of the
same funds. See the article entry Payback Period for more on calculating and interpreting Payback Period.
Internal Rate of Return (IRR)
Using the incremental cash flow for the Proposal Scenario compared to Business as Usual, the internal rate of return for this cash flow stream is a very large 3,141%. (See the encyclopedia entry internal rate of return for more on calculating and interpreting IRR.)
Conclusion From Financial Metrics
The very large ROI, IRR, and NPV, and the relatively short Payback Period all argue strongly for undertaking this action (launching the product). However, before committing to action, management will also want to see a thorough risk analysis for the proposal business case. Risk analysis will show the probabilities of actually achieving forecast results as well as the probabilities of seeing very different results.
Is the Business Case CF Statement a Real CF Statement?
Business Case CF Statement vs. Financial Accounting CF Statement
Business people with a background in finance or accounting who have little experiences with business case analysis sometimes ask questions like these:
- Are these business case statements legitimate cash flow statements?
- How do they compare with the more familiar financial accounting CF instrument,
the statement of changes in financial position?
The business case cash flow statements appearing here are by all criteria rightly called "cash flow statements." They differ from financial accounting CF statements only in that these statements are forward-looking, whereas the statement for an accounting report looks backward in time. In either case, the statements show inflows and outflows separately, and then present their net result.
For
those who are familiar with the financial accounting cash flow
statement, but less familiar with the business case statements,
Exhibit 6 below presents the major points of difference between the
two kinds of statements.
| Exhibit 6 | Business Case Cash Flow Statement | Financial Reporting Cash Flow Statement |
|---|---|---|
| Typical Statement Name | Proposal scenario cash flow statement. | Statement of changes in financial position. |
Statements Published | At least one statement for each scenario analysis in the case, including a "Business as usual" scenario. |
One statement for the company, published at the end of each reporting period, usually the end of each fiscal quarter and year. |
| Major Sections |
1. Benefits. 2. Costs. | 1. Sources of Cash. 2. Uses of Cash. |
| Time Covered | A series of months, quarters, or years, into the future. |
The reporting period just ended quarter or year. |
Cash Flow Statement Structures
Business case cash flow statements—like financial accounting CF statements—have a simple structure with two major sections:
- Cash inflows (or Benefits, or Sources of Cash)
- Cash outflows (or Costs, or Uses of Cash).
That is the basic structure of the example statements in Exhibit 1, above. Exhibit 7 below, shows the basic structure again with just a little more detail:
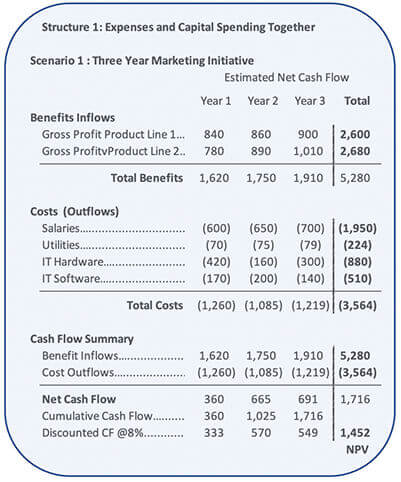
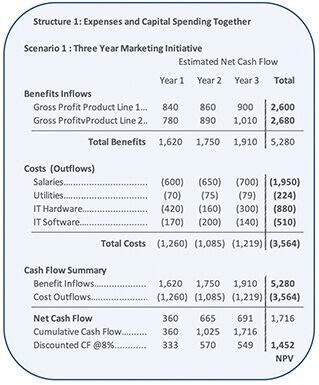
Notice especially the Cash Flow Summary at the bottom. For business case scenario cash flow statements, it is useful to have:
- A summary line totaling benefits (cash inflows) and another totaling costs (cash outflows). In the full-value statements, these lines are helpful for budgeting, planning, and revenue forecasting.
- A summary line for net cash flow, period by period, and in total. This line is the scenario's net cash flow, for the cost and benefit items analyses.
- A summary line for cumulative cash flow, period by period. This summary helps show when cumulative cash flow goes from negative to positive. The point in time when that occurs signals when "Payback" occurs.
- A summary line for present values (discounted cash flow values), whose total is the Net Present Value (NPV) of the net cash flow stream.
Exhibit 8 below, is a slightly more complex cash flow statement. This version distinguishes between costs that are operating expenses and costs that are expenditures for capital items.
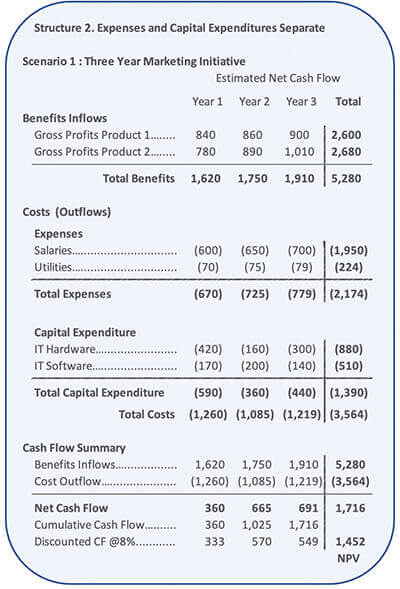
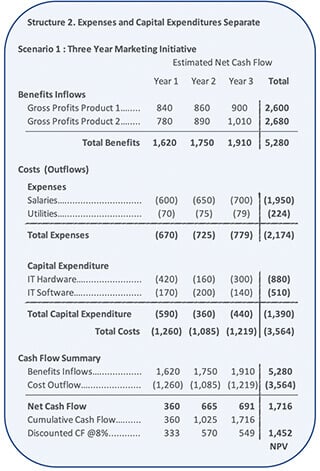
Exhibit 8 above also the major sections "Benefits" and "Costs." However, the "Costs" section has two sub-sections:
- Assets (capital spending)
- Expenses.
It is useful to structure the "Costs" section this way only when the proposal action or investment involves both kinds of spending. The distinction is useful in such cases because companies plan and manage capital spending (CAPEX) under a different budget then they use for operating expenses (OPEX). In other words, requests for the capital funding component of a proposal may have to go to different managers, with different priorities, and different spending criteria, then do requests for funding the operating expenses.
The final cash flow statement structure appearing here represents the after-tax business case in Exhibit 9, below. Cash flow statements in this kind of case show the likely tax consequences of the forecast cash inflows and outflows.
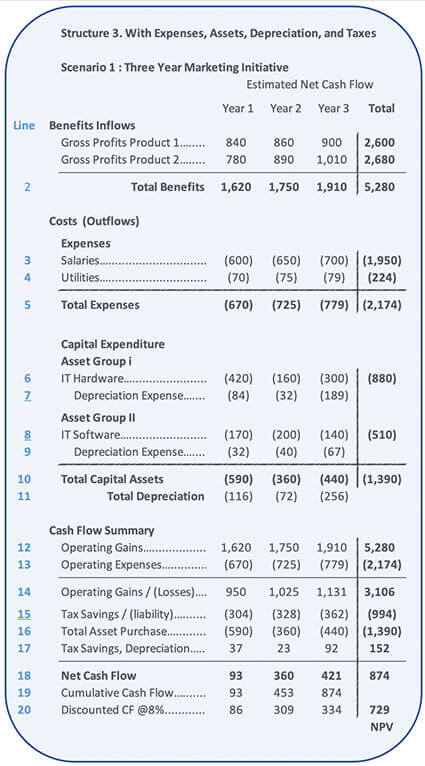

Most business cases for decision support or planning do not need to consider tax consequences of forecast cash inflows and outflows. There are two situations, however, where case-builders should consider building tax consequences into the cash statements:
- Tax impacts belong in the cash flow statements when the business case subject itself concerns tax consequences. For example:
- in "Lease vs. Buy" business cases, decision-makers usually need to compare the tax consequences from buying with the tax impacts under leasing.
- For a decision-support case comparing business performance forecasts for operating in different countries will almost certainly need to include tax consequences from choosing one country over another if the countries have different taxing structures.
- When senior managers focus especially on the impacts of different action alternatives on the firm's income (earnings) after taxes.
Note that depreciation expenses in lines 7, 9, and 11 do not contribute directly to the cash flow total Net Cash Flow in line 18. However, the depreciation expenses do create the tax savings from depreciation appearing in line 17. Tax savings from depreciation expense are real cash flow. (For more on tax savings from depreciation, see the article Depreciation.)
Requirements for Building Business Case CF Statements
What Do You Need to Know to Start Building the CF Statement?
When can the analyst begin building the business case cash flow statements?
On the surface, the full-value cash flow statements appear to be little more than a simple table, with a list of benefit and cost line items on the left, and columns indicating periods (months, quarters, or years). Table cells will fill with cash inflow or outflow estimates for each line item in each period.
The analyst must have a table structure like this in place before beginning to make cost and benefit cash flow estimates. However, designing the structure is straightforward only after several other business case design elements are in place. Before trying to create the cash flow statement structure, the case builder should have the following case design elements in place:
- A subject statement describing potential actions under consideration and the business objectives addressed by the actions.
- A purpose statement, describing who will use the case results, for what purpose, and specifically what information they need to meet that purpose.
- A list of the action scenarios under consideration for the case. Each cash flow statement must include all cost and benefit items included in all scenarios.
- Scope and boundary statements for the case. That is, the specification of the period the case covers, and all information necessary for determining whose costs and whose benefits are to include.
- A cost model, identifying cost items appropriate for the case.
- A list or inventory of benefit items appropriate for the case.
For more on business case design and design elements, see the encyclopedia entry business case. Or, for complete coverage, see the book Business Case Essentials.

