What is Payback Period?
When choosing between potential investments, other things being equal, analysts prefer the one with the shorter payback period.
The Payback period (PB) is a financial metric for cash flow analysis that addresses questions like these:
- How long does it take for investments or actions to pay for themselves?
- When do incoming returns begin covering investment costs?
- How long before the investment becomes profitable?
The answer to such questions is a measure of time—the payback period. Investment Payback period is the time it takes for "cumulative returns" to equal "cumulative costs." In other words, the payback period is the break-even point in time. The calculated PB result usually appears in decimal years, like this:
Payback period = 2.5 years
Businesspeople undertaking expensive actions—which they view essentially as business investments—have a serious interest in knowing PB as precisely as possible. In fact, financial officers sometimes stipulate a maximum PB they will accept, with statements like this: "We will fund no actions or investments that have a payback period of 3.0 years or more."
Like other cash flow metrics, payback period takes an "investment view" of the cash flow stream that follows an investment or action. Other "metrics" with an investment view include net present value NPV, internal rate of return IRR and return on investment ROI. Each metric compares expected costs to expected returns in one way or another.


When Do We Break Even? Break-Even Point As a Time Period
When a new business is starting up, owners, investors, and employees have one fundamental question in mind: When does the business break even? That is, when do we start making a profit? Payback period is the time necessary for investment returns to cover investment costs. Payback analysis does not consider units sold, but instead the timing and magnitudes of cash inflows and outflows. In this way, the payback result shows—or measures—the "break-even point" in time.
Break-Even Point as Unit Volume
Note that business people also refer to a similar but different concept, the break-even point in business volume, or units sold. This break-even point is the unit volume that balances total costs with total gains. For the analyst, break even in "volume" is the quantity Q for which cash outflows equal cash inflows, exactly. At the break-even quantity, therefore, net cash flow equals zero.
See the article Break-Even Analysis for more on calculating break-even volume.
Payback Period and Break-Even Volume in Business Startups
Business people starting a new business need especially to understand both kinds of break-even points: Payback period (break-even time), and break-even unit Volume. They need to have both in view is because startups typically lose money for a while before becoming profitable. There is a limit, however, to the time owners can tolerate losses. Before launching a new business, therefore, they have a keen interest in knowing the likely payback period. A decision to start the company may depend on the owners' view of the time and expense required to reach payback.
Explaining Payback Period in Context
Sections below further define and illustrate Payback Period in context with related terms and concepts from business analysis, investment analysis, and cash flow management, focusing on three themes:
- First, the nature of the "Payback" concept, including payback in time and payback in business volume.
- Second, the calculation and meaning of the cash flow metric Payback Period.
- Third, the mathematical basis of the Payback calculation.
- Fourth, interpreting Payback calculation results and common misinterpretations of Payback metrics
Contents
- What is "payback period?"
- Why is a shorter payback better than a longer payback? How is payback period related to risk?
- Explaining and calculating the payback period.
- How is payback period explained in mathematical terms?
- What are the essential considerations in using the payback metric?
Related Topics
- Break-even point, break even business volume. See Break Even.
- Cash flow metrics, including NPV, IRR, ROI, and Payback. See Financial Metrics.
- Explaining and measuring cash flow. See Cash Flow.
Why is a Shorter PB Preferred to a PB?
How Is Payback Period Related to Risk?
Other things being equal, the investment that pays for itself in the shorter time is considered a better choice. Business people prefer the shorter period because:
- The investor recovers the investment costs sooner. And, funds are available again for further use.
- Most people consider the shorter payback period as less risky.
Analysts often assume that the longer it takes to recover funds, the more uncertain is the positive return. For this reason, they sometimes view payback period as a measure of risk, or at least a risk-related criterion to meet before spending funds. A company might decide, for instance, to undertake no significant expenditures that do not pay for themselves in, say, three years.
Explaining and Calculating Payback Period
Example Calculations
As an example, consider a five-year investment whose cash flow consequences appear in the table below. The primary figures for calculating the payback period are the cash inflows and outflows from the action:
- Cash Inflows
$300 cash inflows occur each year, for years 1 through 5. - Cash outflows
The initial cost is a cash outflow of $800 in year1. Another expenditure of $150 occurs in year 2. There are no costs in years 3 through 5.
From these figures, the analyst creates two sets of cash flow numbers to use for the calculation (the bottom two rows of the table):
- Net cash flow
The net of cash inflows and outflows for each year. - Cumulative cash flow
The sum of all cash inflows and outflows for all preceding years and the current year.


Calculating Payback Period
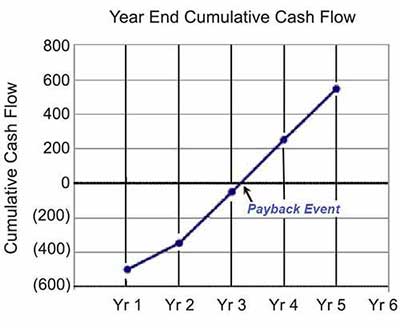
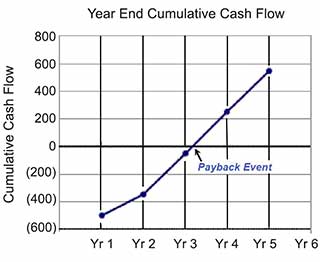
At what point in time does the investment break even? Look at the "cumulative" cash flow at the bottom, and see that payback clearly clear occurs sometime in Year 4. We know it happens in Year 4 because cumulative cash flow is negative at the end of Year 3 and more than zero at the end of Year 4. But where, precisely, is the break-even event in Year 4? An approximate answer appears on a graph, showing PB as the point in time when cumulative cash flow crosses from negative to positive:


In reality, break-even may occur any time in Year 4 at the moment when the cumulative cash flow becomes 0. However, if the analyst has only annual cash flow data to work with (as in this example), and no further information about when cash flow appears within Year 4, the analyst must assume the year's cash flows occur evenly through the year.
In this case, the analyst must estimate the payback period using interpolation, as the examples and here and in the next section illustrate. The assumption that cash flow is spread evenly through each year accounts for the straight lines between the year-end data points above.
Using the tabled data above, where cumulative cash flow reaches 0 in Year 4, PB calculates as follows;
Payback period = Y + ( A / B ) where
Y = The number of years before the payback year. In the example, Y = 3.0 years.
A =Total remaining to be paid back at the start of the break-even year. This amount brings cumulative cash flow to 0. In the example, A = $50.. In the example, A = $50.
B = Total (net) cash inflow in the entire payback year. In the example B = 300.
For this example,
Payback period = 3+ (50) / (300)
= 3 + 1/6 = 3.17 Years
In brief, PB calculated this way is an interpolated estimate between two of the period end-points (between the end of Year 3 and the end of Year 4). Interpolation was necessary because the only figures we have to work with are the annual cash flow figures.
Payback Period Mathematics
Calculated Examples
The payback period instructions in the previous section are easy to understand because they describe in simple verbal terms the amounts to add or divide. However, when the analyst tries to build these instructions into a spreadsheet formula, the implementation becomes somewhat cumbersome. In any case, the spreadsheet programmer needs at least a simple understanding of the quantities to identify and use for calculating PB.
Consider the cumulative cash flow curve (such as that above for the tabled example) again. The graph below now focuses on the break-even year (here, Year 4) and the year before that (Year 3).


With simple principles of plane geometry, it is possible to show that two ratios in the above figure are equivalent:
| A | / | B | = C / 1.0
This fraction, C, plus the number of whole years before the payback year (Y), is PB:
Payback Period = Y + C
Implementing the PB metric in a spreadsheet requires that the analyst have access to individual annual figures for both net cash flow and cumulative cash flow (the last two rows of the table above). The programmer builds logical tests (IF expressions in Microsoft Excel) to find the first year of positive cumulative cash flow. Then, with the payback year known, the calculations use both the annual and cumulative cash flows from the break-even year and the year before that, to calculate the lengths of line segments A and B from the diagram above. (See Financial Metrics Pro for working examples).
Essential Considerations for Payback Period Metrics
Are Multiple PB Periods Possible? Where is PB Blind?
Payback period is an appealing metric because its meaning is easily understood. Nevertheless, here are some points to keep in mind when using the payback period:
- The analyst cannot calculate PB if the positive cash inflows do not eventually outweigh the cash outflows. That is why this metric is of little use when used with a pure "costs only" business case or cost of ownership analysis.
- There can be more than one payback period for a given cash flow stream. PB examples such as the one above typically show cumulative cash flow increasing continuously. In real-world cash flow results, however, "cumulative" cash flow can decrease or increase from period to period. When "cumulative" cash flow is positive in one period, but "negative" again in the next, there can be more than one break-even point in time.
- The PB metric by itself says nothing about cash flows coming after "cumulative" cash flow first reaches 0. One investment may have a shorter PB than another, but the latter may go on to greater cumulative cash flow over time.
- The payback calculation ordinarily does not recognize the time value of money (in a discounting sense).

