What Is Cash Flow in Business?
Every business must learn to manage revenues and expenses, on one hand, but also cash inflows and outflows on the other.
Every business must manage and control Cash Flow and its cash accounts with the same attention it applies to revenue and expense accounts.
- When expenses exceed revenues, the business is unprofitable.
- When cash outflows exceed cash inflows, the business is soon unable to pay bills, maintain day-top day operations, or pay employees.
Define Cash Flow
Cash Flow refers literally to the flow or movement of cash funds into or out of a business.
Some people prefer an alternative definition that means exactly the same thing: Cash flow refers to an increase or decrease in cash funds on hand.
Moving water is a famailiar metaphor for moving cash funds. Cash payments into or out of the firm are cash flow events. A series of cash flow events is a cash flow stream. A firm pours funding into a costly project and drains the supply of working capital (available cash). Assets that can turn quickly into cash are liquid assets. The firm has sufficient liquidity if it can pay its ongoing bills on time.


Cash Flow vs. Revenues and Expenses
Business people distinguish cash flow from accounting terms such as Income, Revenue, Expense, and Cost, all of which may result in CF, but which are not that themselves.
- Consider a person paying a restaurant bill with a credit card (a charge card, not a bank debit card). As a result, dinner is an expense event, but not cash flow for the diner. Cash flow occurs later when the cardholder pays the credit card bill.
- A company may purchase goods or services on credit and register a charge (liability) in its accounts as an account payable. The firm removes the liability later with a different event when cash flows from buyer to seller.
- A company may sell goods or services, send the customer an invoice requesting payment, and recognize revenue earnings with a transaction in its accounts as an Account Receivable. Cash flow from the sale comes later when the customer sends payment.
Cash Flow Management
Individuals and companies in business must manage revenues, and expenses, on the one hand, and cash inflows and outflows on the other. The majority of businesses worldwide use accrual accounting, by which they report revenues in the period they earn them, along with the expenses they incur in earning the same revenues. The resulting cash inflows and outflows may or may not occur in the same period.
The Accrual Accounting Challenge
For firms using accrual accounting …
- The timing and management of revenues, costs, and expenses are critical for reporting earnings, determining taxes, and declaring dividends.
- The timing and management of cash flow are critical for meeting obligations and needs. These may include paying employee salaries and wages, and paying interest on loans or bonds. Cash flow needs also include the costs of developing new products and upgrading the infrastructure.
Tax authorities also allow businesses to report some noncash expenses on the Income statement. The best known noncash expense is depreciation expense, while others include amortization and writing off bad debts. These are charges against earnings solely to lower income the firm reports, (thereby lowering taxes). They do not represent actual CF.
Cash Flow Reporting
Firms report actual CF gains and losses for the period directly on another reporting instrument, the Statement of Changes in Financial Position (SCFP), or equivalently, Cash Flow Statement, or Funds Flow statement. Noncash expenses do not appear on the cash flow statement.
Note, incidentally, that for the few firms that use cash basis accounting instead of accrual accounting, the distinction between cash flow on the one hand and accounting terms (income, revenue, expense, and cost) on the other hand, largely disappears. Cash basis accounting is "all about" CF and little else.
Business Analysis of Cash Flow
Cash flow and Net CF are center stage in two kinds of business analyses:
- Financial statement analysis.
Cash assets and cash flows contribute to metrics for evaluating a firm's financial position—especially its ability to meet current obligations and take action on short notice. - Business case and investment analysis.
Cash flows are the basic input and output of a proposed investments or actions. CF estimates enable analysis with cash flow metrics such as Net Present Value (NPV), Internal Rate of Return (IRR), Return on Investment (ROI), and Payback Period.
Explaining Cash Flow in Context
Sections below further explain cash flow concepts in context with related terms from business analysis, accounting, and cash management, emphasizing four themes:
- First, defining cash flow and cash flow management, as distinguished from accounting terms such as expense and revenue.
- Second, showing how the practice of cash flow management uses cash flow metrics such as Net Present Value, Internal Rate of Return, and Return on Investment to track and evaluate cash movements.
- Third, cash flow metrics for investment analysis.
- Fourth, cash flow in financial reporting, including the Statement of Changes in Financial Position (Financial Cash Flow Statement).
Contents
Cash Flow in Financial Statement Analysis
Public companies everywhere publish financial reports at the close of each accounting period. For obvious reasons, the firm's owners, officers, managers, and employees all take a keen interest in the latest figures on the firm's financial performance and financial position. And, industry analysts, competitors, and government regulators also watch the same figures closely. Everyone with interest in the company wants to know if the company is operating profitably now and if it is likely to do so in the future. Successful companies achieve the following:
Business firms must learn to manage revenues and expenses, on the one hand, and cash inflows and outflows on the other.
To address these concerns, most business people turn first to the Income statement and Balance sheet, where they extract metrics on financial performance (such as Net profit margin and financial position (such as the Debt to equity ratio).
There is. however, another important issue that also concerns the firm's ability to operate now—and either thrive or die in the future. The issue is the firm's ability to generate and manage cash flow effectively. To address cash flow questions, investors and analysts turn to the firm's cash flow statement.
Firms report their cash flows for a reporting period on a Cash Flow Statement (or Statement of Changes in Financial Position SCFP). The SCFP is one of four primary reporting instruments that publicly traded companies publish quarterly and annually. The other three are the Income Statement, Statement of Retained Earnings, and the Balance sheet (or Statement of Financial osition). These four reports are the primary source of input data for financial statement metrics (business ratios).
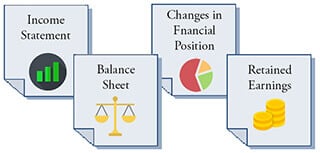
Statement of Changes in Financial Position: The Cash Flow Statement
The financial Cash Flow Statement (or SCFP) reports actual cash inflows during the period as Sources of Cash and actual cash outflows as Uses of Cash. Net Cash Flow for the period is the difference between total Sources of Cash and Total Uses of Cash.
The financial accounting cash flow statement shows management, owners, analysts, and authorities the cash holdings available to work with, as well as cash gains and losses during the period just ended. By contrast, the Income statement (or Profit & loss statement, P&L) tells everyone what the company reports for earnings during a period.
The cash flow statement also helps explain the differences between the current Balance sheet and the previous period's Balance sheet. Note especially that some companies (e.g., IBM) call their Balance sheet a "Statement of Financial Position." This usage helps explain why the financial accounting CF statement is also known as the "Statement of Changes in Financial Position."
For example, cash flow statements and more in-depth coverage of SCFP relationship with other financial statements, see Statement of Changes in Financial Position.
Cash As An Asset
The firm's end-of-period cash holdings also appear as an Asset account on the Balance sheet called Cash on Hand or something similar. On the Balance sheet, Cash on Hand appears under Current Assets, along with other relatively liquid assets such as Inventories, Accounts Receivable, Short-Term Notes Due, and Marketable Securities, and Short-Term Investments Due. When addressing concerns about the firm's liquidity, analysts focus on all current asset categories.
Three Metrics for Liquidity
The term liquidity refers to a firm's ability to meet short-term spending needs. These typically include cash payments for employee salaries and wages, utility bills, and financing charges due. "Cash on Hand" is by definition the most liquid of assets. However, businesspeople also see the other current assets such as inventories and accounts payable as relatively liquid because these assets, also, should transform into cash in the near term.
Note that the Balance sheet "Cash on Hand" account contributes to financial statement liquidity metrics such as Working Capital, Current Ratio, and Quick Ratio. All three examples of these metrics below calculate from the same Balance sheet figures.
Consider, for example, a company whose end-of-year Balance sheet reports:
Current Assets: $9,609,000
Current Liabilities: $3,464,000
Inventories: $5,986,000
Liquidity Metric 1: Working Capital
Working Capital is simply the firm's Current Assets balance less its Current Liabilities balance. Both appear on the Balance sheet. Working Capital is figures are currency units (for example, dollars or euro). For the example firm:
= Current Assets – Current Liabilities
= $9,609,000 – $5,986,000 = $3,623,000
Liquidity Metric 2: Current Ratio
The Current Ratio uses the same Balance sheet input figures as Working Capital, except that it makes a ratio of them. As a result, Current Ratio is the ratio of Current Assets to Current Liabilities. For this example:
= Current Assets / Current Liabilities
= $9,609,000 / $5,986,000
= 1.61
Liquidity Metric 3: Quick Ratio
A more severe variation on the Current Ratio is the Quick Ratio metric (or Acid-Test Ratio). Analysts calculate Quick Ratio in the same way they calculate current ratio, except that the Quick Ratio numerator essentially uses only the most liquid of the Current Assets: Cash, Accounts Receivable, short-term notes due, marketable securities and short-term investments due. The Quick Ratio numerator does not include current assets that many consider being relatively illiquid, namely Inventories. For the example firm:
= (Current Assets–Inventories) / Current Liabilities
= ($9,609,000 – $3,464,000) / $5,986,000
= 1.03
Quick Ratio vs. Current Ratio: What's the Difference?
Which is the better measure of a firm's liquidity: Quick Ratio or Current Ratio? The best answer to that question may differ between firms. The analysis must consider firms individually before answering because the answer depends on the true liquidity or illiquidity of the firm's inventories. And, the answer also depends on the relative magnitude of Inventories in the firm's asset structure.
The Current Assets figure input for both metrics includes Cash on Hand, as well as other assets that could—in principle—turn quickly into cash (primarily Inventories and Accounts Receivable, but also Short-Term Notes Receivable, Marketable Securities, and Short-Term Investments Due.
Liquidity Metrics and Cash Position
Management normally takes an especially keen interest in knowing the current Working Capital figure when budgeting and planning projects, programs, and products. The current Working Capital status is especially important when budgeting for expensive for infrastructure improvement or research and development. Working Capital must be sufficient for these plans, as well as covering financial expenses (e.g., paying interest on bonds) and operational expenses (such as paying employee salaries).
Metrics results such as the following signal a weak cash position:
- Negative Working Capital,
- A Current Ratio of less than 1.2
- A Quick Ratio of less than 1.0
In such cases, the firm is going to have trouble meeting payroll or other short-term obligations. By contrast, an abundance of Working Capital, a high Current Ratio, or a high Quick Ratio indicate the opposite. With sufficient cash on hand, the firm can pursue investments such as new market entry, product research and development, or upgrading corporate infrastructure. It can take these actions without borrowing or putting other critical operating needs at risk.
Can a Firm Have Too Much Cash?
Finally, regarding Cash on Hand, financial analysts sometimes believe it is possible for a firm to have too much liquidity. Several highly successful technology firms, for instance, are frequently accused of poor financial judgment because they hold substantial sums of extra cash, essentially sitting idle in bank accounts. As a result, these firms have Current Ratios and Quick Ratios of 5.0 or even higher.
Such criticism is especially likely when a firm holds far more Working Capital than it will need or use soon. The firm's officers are expected to make the best possible use of the firm's assets, after all. Idle cash is, arguably, not serving a good purpose.
Business Case & Investment Cash Flow
The simplest kind of investment analysis has only two cash flow events: Firstly, the original investment (a single cash outflow) and secondly, the receipt of returns (a single cash inflow). That scenario describes an investor who buys a non-coupon paying bond such as a US Government savings bond and holds it to maturity. The two-event CF scenario also describes an investor who makes a winning bet on a racehorse. Investment metrics such as simple ROI, yield, and NPV. all help evaluate two-event investments like these.
The Investment As a Cash Flow Stream
In business, however, investments and actions typically bring a series of cash inflows and outflows over time. The resulting cash flow stream for a large business may look something like Figure 1 below:
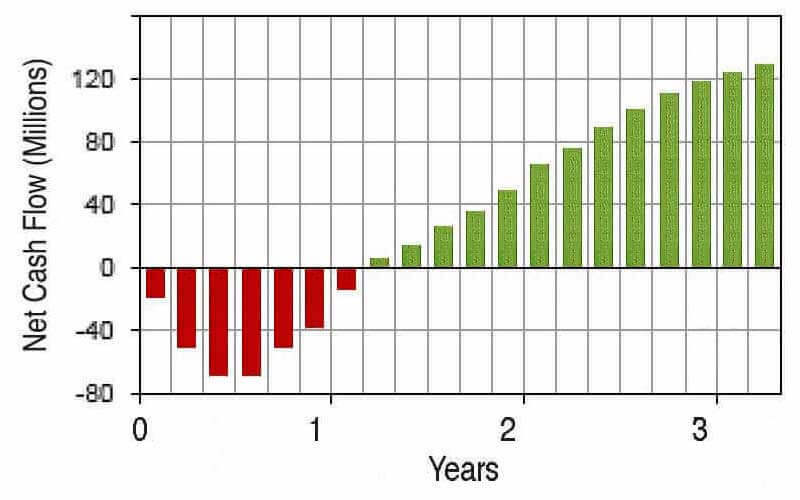
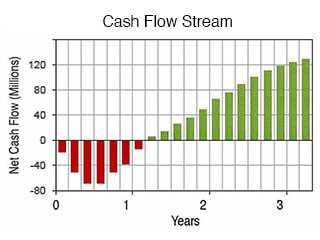
This kind of cash flow stream may result, for instance, from actions such as …
- Business investments of many kinds.
For example, buying bonds or investing in real estate properties. - Acquiring capital assets.
Such as acquiring production machinery, vehicles, or computer systems. - A decision to fund and launch a project or program.
For instance, a marketing program or an employee training program. - A decision to add a line of business.
For example, adding an after-sales customer service business. - A large set of activities and investments that are the focus of a single business case analysis scenario.
Graphical CF Metrics With Investment View
After forecasting a cash flow stream of this kind, management takes the analysis further with financial metrics and graphics to address questions like these:
- Does this investment represent a good business decision?
- How do returns compare to investment costs?
- How does this investment or action compare to other potential uses of the same funds?
- Which possible course of action is the better business decision?
In this way, projected CF and its analysis lie at the heart of the financial business case. The next sections show how analysts address such questions:
- Firstly through cash flow graphics.
- Secondly, with cash flow metrics.
Note especially that metrics for this purpose take an investment view of the cash flow stream. This means, essentially, that these metrics compare investment costs to investment returns, each in its own way. And, each of metric sends a unique message about the body of cash flow data. The primary metrics for cash flow analysis include:
- Net Cash Flow Net CF
- Cumulative Cash Flow
- Net Present Value NPV
- Simple Return on Investment ROI
- Payback Problem Period
- Internal Rate of Return IRR
Cash Flow Metrics: Graphical vs. Numerical Analysis
The following two sections show best practice approaches for graphing Net Cash Flow and Cumulative Net Cash Flow. Both sections derive data for graphic from Table 1, immediately below. And, other sections further below show how to calculate and interpret these metrics.
Example: Cash Flow Stream for Graphical Analysis
Consider an action or "Proposed Investment." Data for plotting the cash flow consequences of making the Investment begin with the estimated cash inflow and cash outflows in Table 1.
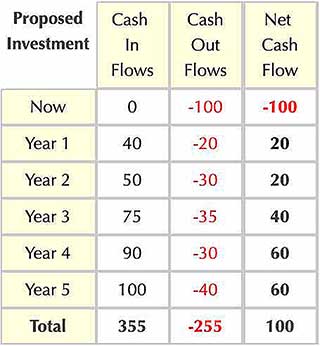

The data table alone shows clearly the cash flow forecast of $100 over five years. With these data in hand, the challenge now is deciding how best to:
- Summarize and describe the cash flow data forecast.
- Further analyze and evaluate the cash flow stream.
Graphing Net Cash Flow
Reports and presentations on cash flow analysis are clearer, and easier to understand, when authors present both graphics and figure tables to describe cash flow events.
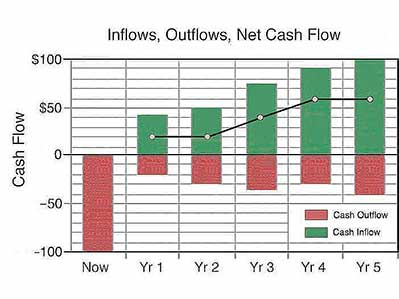
- Cash flow graphs, such as Figure 2 below, add visual appeal. They grab reader attention and the relieve the monotony of pure text. Beyond this, however, graphics communicate a "feel" for the overall flow pattern across time. Such a "feel" is not so easy to grasp solely from reading numbers. As a result, many analysts make it a rule always to include cash flow graphs in the report Executive Summary.
- It is good practice also to include tables of cash flow numbers in reports, such as Table 1. Figures enable readers to check the author's calculations for themselves. They also help those who will calculate still other metrics, or combine data sets from different reports.
A cash flow stream, such as the figures in Column 3 of Table 1, normally appears as a series of vertical bars, as in Figures 2 and 3 below. Note especially that these bar charts show both the timing and the magnitudes of cash flow events. The complete chart also shows the profile of the entire cash flow stream.


Graphing Cumulative Net CF, PV
It is often helpful to present Net Cash Flow figures and graphs along with other metrics that result from these figures. Readers may want to see Cumulative CF, and CF Present Values (PVs) as well as the Net CF figures. For this, the analyst finds each period's cumulative CF and Present Value (PV), as Table 2 shows, below. Here, each year's cumulative CF and PV derive from the Net CF figures.


Graphing Cumulative Cash Flow
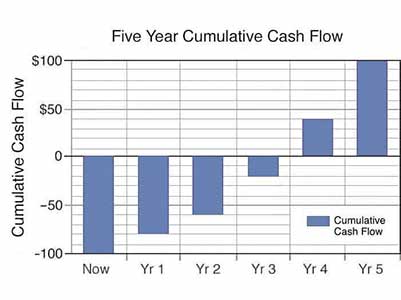
Cumulative figures show the total Net Cash Flow through the end of each period. The cumulative value for Year 3, for instance, is the sum of the Year 3 Net Cash Flow plus the net figures for Year 2, Year 1, and the initial outflow:
Yr 3 Cumulative Cash Flow = $40 + $20 + 20 – $100
= $80 – $100
= –$20.
Analysts typically present Cumulative Cash Flow for the entire cash flow stream with a vertical bar chart, such as Figure 4 below.
Finding Payback Period From Cumulative Cash Flow
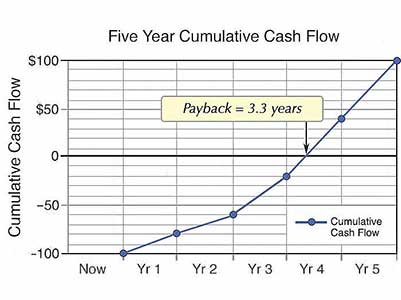
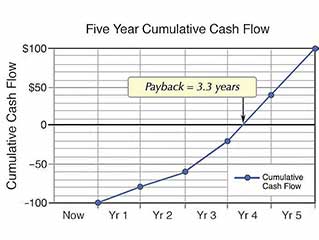
Analysts sometimes instead present Cumulative Cash Flow for the cash flow stream with a line chart, as in Figure 5 below.
- The line chart is appropriate when the rate of cash flow is more or less constant during each period.
- The vertical bar chart is more appropriate when cash flow during the period fluctuates, or appears only at period end.
- The line chart also reveals investment payback time more precisely than the bar chart. Payback Period is the time required for an investment to "pay for itself," or break even. This is the point in time (horizontal axis) where the cumulative cash flow reaches 0 (vertical axis). Here, payback appears at 3.33 years.
Graphing Note: Exhibit 5 above appears as a line chart, as intended. When creating this chart with MS Excel, be sure to create the Line chart using Excel's X-Y Scatter Plot Chart, not Excel's Line chart. Only the scatter plot places data points appropriately at each year end on the horizontal axis. As a result, the payback event appears at the correct point in time.
Graphing Net Cash Flow and Discounted Cash Flow Together
When the Net Cash Flow figures also serve as input for discounting analysis, the analyst can graph each net figure alongside its Present Value, as figure 6 shows.
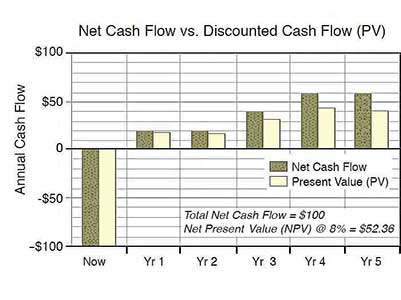
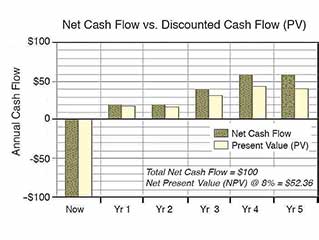
In Figure 6, each Present Value is the future net figure (here, called Future Value), divided by (1+ i )n, where i is an interest rate (Discount rate) and n is the number of interest periods (here, years).
Using an 8% discount rate, the Year 3 Present Value is $31.75, the result if dividing the future net figure,$40, by (1 + 0.08)3 (That is, $40 divided by 1.26).
Six Cash Flow Metrics Compare Investment Proposals
Cash flow projections often serve as the starting point for comparing different investment possibilities or different business case scenarios.
Which possible investment should the investor choose? Sections below show how analysts use cash flow metrics to address this question.
Comparing Example Cash Flow Streams
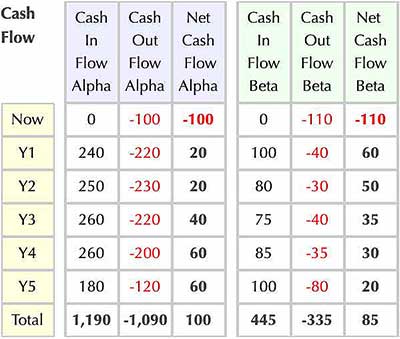
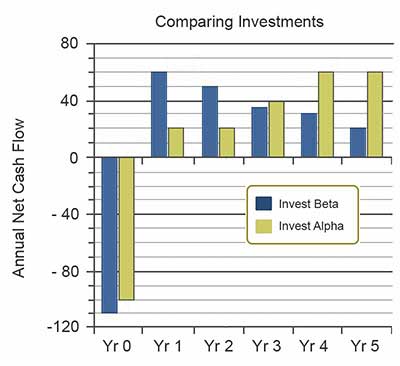
Consider, for example, two competing investment proposals, Investment Alpha and Investment Beta. The forecast cash flow streams that should follow for each investment appear in Table 3 and Figure 7 below:

Which Investment, Alpha or Beta, is the Better Business Decision?
Analysts will try to answer this question by evaluating the forecast cash flow streams for each alternative. Such analyses typically center on six financial metrics:
- Net Cash Flow.
- Cumulative Cash Flow.
- Net Present Value (NPV).
- Simple Return on Investment (ROI).
- Payback Period.
- Internal Rate of Return (IRR).
It is rarely advisable to base important business decisions on a single financial metric. When comparing different cash flow streams, different metrics can in fact "disagree" as to which stream represents the better business decision. Figure 7 shows the cash flow streams Alpha and Beta from Table 3, for comparison in sections below.
Decision makers will usually want to see how each action alternative scores on several or all of the above metrics before recommending one action over another.
Cash Flow Metric 1
Net Cash Flow
The simplest and clearest cash flow metric for comparing investment streams is Net Cash Flow. Table 3 above shows that Net CF for each investment is simply the sum—the net—of the investment's inflows and outflows across the entire investment period. For these investments, Table 3 above and Table 4 below, show that Alpha's Net Cash Flow of $100 exceeds Beta's Net Cash Flow of $85.
Based on the Net CF difference alone, a few analysts may recommend Alpha as the better business decision. However, prudent analysts know that each financial metric has its strengths and each financial metric—including Net CF—is blind to other aspects of the data. For that reason, most analysts caution against making investment decisions on the basis of a single financial metric.
Calculating Net CF - More to the Story Than Higher Net CF
There is another story lying beneath the Net Cash Flow figures, however. Individual cash inflows and outflows for Beta are much larger than corresponding inflows and outflows for Alpha.
- While Investment Alpha has the higher five-year Net CF, Investment Beta has larger total inflows and outflows.
- Total inflows for Investment Alpha are $1,190 while total inflows for Beta are $440.
- Total outflows for Alpha are $1,090, whereas total outflows for Beta are $355.
Setting aside investment returns and focusing only on investment costs, Investment Beta is 307% more costly than Investment Alpha. Regardless of return rates for Alpha and Beta, the investor may simply be unwilling or unable to budget and pay Beta's larger costs. Before committing to Investment Beta, the investor will consider whether the extra funds for Investment Beta might instead serve better use elsewhere.
Cash Flow Metric 2
Cumulative Cash Flow
Analysts will probably have questions about period-to-period Cumulative Cash Flow for each investment. Note that Cumulative Cash Flow through the final period, of course, simply equals total Net Cash Flow for all periods. However, it may be important ask Cumulative Cash Flow questions about individual periods such as these:
- During which period does Cumulative Cash Flow first exceed $50?
- In which period does Investment Alpha pay for itself? This is the same as asking "When does payback occur for Investment Alpha?
Cumulative CF for Two Cash Flow Streams
To address such question, the analyst prepares a table showing Cumulative Cash Flow for each investment. Such a table appears as Table 4, below:


- The table shows, for instance, that Beta's Cumulative Cash Flow first exceeds $50 in year 4, while Alpha's cumulative does not exceed $50 until the final period, year 5.
- Regarding payback for Alpha, the analyst can see from Table 4, that Alpha's payback must occur in year 4 because year 3's end-of-period cumulative total is negative (-20) while year 4's is positive (40). At some time during year 4, therefore, Cumulative Payback Crosses From negative to positive.
The section below on Metric 4, Payback Period, shows how the analyst calculates Alpha's payback more precisely as 3.33 years.
Cash Flow Metric 3
Net Present Value NPV
The analyst found with cash flow metric 1 above that Alpha's Net Cash flow exceeds Beta's by $15. The question now is whether or not Alpha will retain the same kind of advantage when considering the Time Value of Money. Discounted cash flow calculations for Net Present Value will address this question.
Of the five metrics appearing here, only NPV measures the time value of money directly. Calculating NPVs with an 85 discount rate, Investment Beta has an NPV of $51.87 while Alpha's NPV is $52.36. As a result, the Net Present Value results favor Investment Alpha—very slightly.
Calculating NPV
The analyst finds Net Present value (NPV) for Investment Alpha as follows:
- FVj for each yearly period j = Net CF for the period
- Discount rate i = 8.0% ( 0.08) for example period
- j = 0 (now) through 5 (Year 5).
+ 20/(1+.08)2 + 40/(1+.08)3
+ 60/(1+.08)4 + 60/(1+.08)5
= –100 + 18.52 + 17.15 + 31.75
+ 44.10 + 40.83
= $52.36
Using the same approach with Investment Beta's Net Cash Flow figures for FVs, NPVBeta = $51.87. The conclusion is that in terms of NPV alone, Alpha has a better NPV. Nevertheless, Alpha's NPV advantage is very small.
Some will ask why the NPV difference is so small, given that these investments showed a much larger difference in Net CF. The reason has to do with the difference in shapes, or profiles, of the two cash flow streams.
With Table 3 and Figure 7 above, it is easy to see that Beta has the "early returns" while Alpha shows its larger returns later in the five-year period. Alpha's cash flow profile is backloaded, in other words, while Beta's profile is front loaded. Because Alpha's large gains are more distant in the future, discounting impacts Alpha's large gains more severely than it impacts Beta's.
Cash Flow Metric 4
Simple Return on Investment ROI (Profitability)
The Simple ROI metric is sometimes said to measure investment "efficiency." In this case, investment, and in this case Investment Beta easily wins the efficiency contest. To grasp the importance of Beta's ROI superiority, it is helpful to think of ROI in terms of its other alternate definition: "Profitability."
ROI Profitability = (Net gains–Net Costs) / (Net Costs)
- For these investments, Alpha shows greater profits: Alpha's profits are $100 while Beta's profits are $85.
- Profitability ratios for these investments are quite different. Alpha's Simple ROI (profitability) is 92%, while Beta's ROI (profitability) is 239%.
The difference in profitability is not surprising. A simple review of Table 4 shows immediately that both investments have similar "returns" (Net CF) but Investment Alpha has much larger "net costs" (Cash outflows flows). Of the cash flow metrics appearing here, only ROI is sensitive to the magnitude of individual costs (cash outflows). Other metrics such as NPV, Payback Period, and IRR are blind to cash outflows themselves because they derive entirely from Net CF figures.
Calculating Simple ROI
Simple Return on Investment (ROI) for this analysis is as follows:
ROI = (Net gains – Net Costs) / (Net Costs)
For Investment Alpha:
ROIAlpha = ((0+240+250+260+260+180)
– (100+220+230+220+200+120))
/ (100+220+230+220+200+120)
= (1,190 – 1,090) / 1090
= 9.2%
Using the same approach, simple ROI for Investment Beta is 23.9%.
For more in-depth coverage on simple ROI as a cash flow metric, and example calculations, see the article:
Cash Flow Metric 5
Payback Period
Financial officers usually prefer a shorter Payback Period over a longer payback. There are two reasons for this preference:
- Firstly, with a shorter Payback Period, returns are considered less risky.
- Secondly, the shorter Payback Period means that investment funds are recovered sooner and available for further productive use.
On the Payback Period metric, Investment Alpha "pays for itself" in 4.33 years, while Investment Beta takes only 2.00 years to cover costs. Payback Period is therefore a strong point in favor of Investment Beta.
Calculating Payback Period
Finding Payback Period for Investment Alpha requires the Net CF and Cumulative CF data from Table 2 above.
- First, notice that Cumulative CF goes from negative to positive between the end of Year 3 and the end of Year 4. Alpha's payback therefore must occur during Year 4.
- Note also that at the end of Year 3, Alpha's Cumulative Cash Flow is – $20 and that Net CF during Year 4 is $60. This information is sufficient to locate the payback point in Year 4 by interpolation.
- At the start of Year 4, $20 more must be "paid back" in order for returns to exactly cover costs.
- The analyst assumes this occurs at 20/60 of Year 4, i.e., after 0.33 years.
- Payback Period for Investment Alpha is thus 4 + 033 = 4.33 Years.
- It is clear immediately from Table 4 that payback for Beta occurs exactly at the end of year 2, the point in time when Cumulative cash flow becomes 0. No further calculations are necessary. Payback Period for Investment Beta is 2.0 years.
Note that this approach works only when Cumulative Cash Flow increases monotonically across time (in other words, cumulative CF always increases from period to period).
For more on the mathematics and meaning of cash flow payback, see the following article:
Cash Flow Metric 6
Internal Rate of Return IRR
When comparing investment cash flow streams, analysts usually find also the internal rate of return (IRR) for each stream. This is because IRR in fact is a popular metric with many financial officers and financial analysts. Some organizations, in fact, use an IRR figure as a hurdle rate. This means that incoming funding requests must project results with an IRR greater than the hurdle rate if they are to receive further consideration.
For more on IRR as a hurdle rate, see the following article:
IRR is popular and used widely, but it is also the most difficult of the 6 metrics appearing here to interpret. Many businesspeople begin to sense the difficulty when they first encounter the textbook IRR definition:
The internal rate of return (IRR) for a cash flow stream is the interest rate (discount rate) that produces a net Present Value of 0 for the cash flow stream.
Other things being equal, the investment with the higher IRR is considered the better choice. Interpreting IRR meaning beyond this, however, requires substantial explanation.
For a complete introduction to the meaning and interpretation of IRR, see the article:
Also no surprise, the heavier "early returns" with Investment Beta compared to Alpha, result in an IRR advantage for Beta. Beta's cash flow stream produces an IRR of 28.6%, while Alpha's IRR is 22.4%.
Both IRR's are certainly much higher than the investor's cost of capital, and for that reason, financial officers will no doubt agree that both investments promise a net gain. However, the higher IRR with Beta is a strong point in favor of Beta. Using the IRR criterion alone, absent other complications, the analyst will recommend investment Beta over Alpha.
Calculating IRR
Analysts calculate cash flow metrics such as NPV, ROI, and even Payback Period, directly from formulas. By contrast, the IRR Definition above does not readily lend itself to expression as a formula.
However, the IRR definition above refers to another metric that does calculate from a formula: Net Present Value NPV. The panel below shows the formula for calculating NPV for a cash flow stream using end-of-period discounting.

Here, the FVs in the formula are Net Cash flow figures for each period, i is the discount rate, while n is the number of periods. For Case Alpha and Case Beta, n = 5. That is, each cash flow stream covers 5 periods and each period is one year.
For more on finding the IRR for a cash flow stream and the meaning of IRR, see the following Article:
Cash Flow Metrics: Conclusions
Which investment, Alpha or Beta, is the better business decision? The financial metrics above provide a mixed "scorecard" on the potential investments.


Which Investment Should the Analyst Recommend?
Part of the information needed for an informed judgment comes from the financial metrics listed above calculated for each cash flow stream. The results for five of these appear in Table 5, below:
However, by this scorecard—and absent any information on investment risks—financial specialists and analysts will probably vote in favor of Investment Beta. In conclusion, Beta is the alternative with the higher NPV, higher IRR, and shorter Payback Period. For many, this will outweigh Alpha's $15 advantage in Net CF and very tiny advantage in NPV.

