What is Depreciation?
Accountants use depreciation conventions to implement the matching concept, achieve accuracy, and create tax savings.
Depreciation is an accounting method that enables asset owners to account for the cost of certain assets over time instead of immediately at purchase.
Depreciation provides owners with several financial benefits. Foremost among these benefits, from the owner's perspective, are large savings in income taxes each year of asset life.
Not surprisingly, asset depreciation is universal practice for tax-paying businesses everywhere.
Define Depreciation
Each year in the life of certain assets, owners charge part of the asset's original cost as an expense against Income statement earnings. The yearly charge against income is Depreciation Expense.
Government tax authorities prescribe depreciation lifespans and schedules that owners may apply with different asset classes,
Charging depreciation expense impacts both the Income statement and the Balance sheet.
- Depreciation expense adds to Accumulated depreciation on the Balance sheet, thereby lowering the book value of the firm's assets
- Depreciation expense—like other expenses—also reduces bottom-line reported income (profit) on the Income statement. In this way, depreciation—a non-cash expense—decreases the firm's income tax liability..
What is the Purpose of Depreciation?
Depreciation expense helps realize a fundamental principle in accrual accounting: the Matching Concept. Matching means that firms report revenue earnings along with the expenses that bring them, in the same period.


Companies incur many kinds of expenses in the course of operating and doing business. All expenses ultimately "go to the bottom line," that is, all expenses lower profits. However, asset owners do not handle the purchase of an expensive, long-lasting capital asset as an expense for a single period—even if the firm buys it with a single cash expenditure. Depreciation expense thus help realize the accrual accounting matching concept, the idea that firms report revenue earnings along with the expenses that bring them in the same period.
With depreciation expense, assets incur expenses over time, as they lose their value to the firm. Under accrual accounting, that is, assets incur "expenses" as they wear out, or deplete. As a result, owners come closer to reporting expenses as they owe them by charging depreciation expense, each year, across the asset's depreciation life. Thus, owners receive the tax benefits of paying for the asset over those years instead of all at once.
Explaining Depreciation In Context
Sections below further define and illustrate depreciation in context with similar terms and concepts from accounting, finance, and asset management, emphasizing four themes.
- First, defining Depreciation as an accounting method, by which owners account for the costs of assets across a number of years, thereby turning asset purchase costs into ordinary expenses over time.
- Second, explaining which asset classes are subject to depreciation.
- Third, showing how depreciation expense each year depends on the asset's cost, depreciation life, and depreciation schedule.
- Fourth, examples showing how to calculate depreciation expense using four popular time-basis depreciation schedules, along with non-time base schedules, and composite depreciation.
Contents
How Does Depreciation Expense Lower Taxes?
Calculating Tax Savings from Depreciation
Each year in the life of a depreciable asset, owners charge part of its original cost against income on the Income statement. The yearly charge is Depreciation Expense, a method by which tax authorities allow owners to account for the purchase cost of expensive assets over time, as the asset loses value. The annual charge depends on several factors, including a Depreciation Schedule for the asset.
From the owner's point of view, depreciation expense serves two purposes. First, in the interest of accounting accuracy, depreciation lets owners charge expenses for the asset as they incur them. Second, depreciation expense allows owners to realize tax savings across the asset's life instead of all at once.
Example: Tax Savings from Depreciation Expense
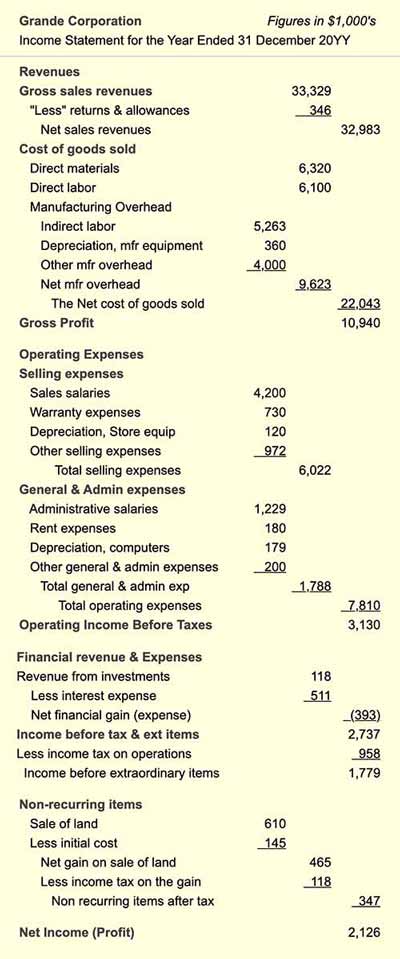
On the Exhibit 1 Income statement, below, Grande Corporation reports income before one-time items of $2,737,000. With a 35% tax rate, the firm pays $957,950 in taxes on this income. Exhibit 1 rounds this figure up to $958 thousand.
Contributing to the firm's expenses, however, are three depreciation items totaling $659,000. Were these depreciation expenses not on the statement, the firm would report a before-tax operating income of $3,396,000 and an income tax of $1,188,600.
Calculating Tax Savings from Depreciation
What is Grande's tax savings from depreciation? Using two income figures from above, the tax savings from depreciation are $230,000. That is:
$1,188,600 – $957,950 = $230,000.
In practice, owners can estimate tax savings from depreciation directly and more accurately, simply by multiplying the depreciation expense total by the marginal tax rate. With a 35% tax rate on income, for example:
Tax savings = 0.35 * $659,000
= $230,650
Notice also that an asset's depreciation expense can appear under any of the Income statement expense headings. Where the expense appears depends on how the firm uses the asset. Here, depreciation expenses appear under:
- Cost of Goods Sold, as Manufacturing overhead, for manufacturing equipment assets.
- Selling Expenses for store equipment.
- General and Administrative Expenses for computers.
Which Assets Depreciate?
Tax Authorities Write the Rules
Generally, assets eligible for depreciation meet three criteria:
- First, the asset has a useful life of one year or more.
- Second, the asset supports the business.
- Third, the asset wears out, decays, becomes obsolete, or otherwise loses value over its useful life.
Tangible assets meeting these criteria may include, for instance, factory machines, vehicles, computer systems, office furniture, aircraft, and buildings. Land, however, is an example of an asset that does not meet the third criterion (losing value). Land assets, therefore, do not depreciate in the same way.
Limited Freedom to Choose Costs for Depreciation
Tax authorities sometimes permit owners to decide for themselves whether or not a given purchase qualifies as a Capital Expenditure, eligible for depreciation. That freedom of choice is limited, however.
So-called Capital Projects, for instance, result in capital assets such as buildings, computing systems, or production lines. After the project, the asset itself goes onto the Balance sheet with a value equal to historical cost—the actual cost of acquiring the asset. Note, however, that capital projects include many activities and purchases. And, some of these would not, on their own, qualify as capital expenditures. As part of a capital-creation project, however, their costs may be reported as capital spending.
The creation of a capitalized IT system, for instance, might include systems integration or software development services. Firms usually report these costs as expenses for the period. As part of a capital project, however, owners can sometimes "bundle" these services in total asset cost. And, in that case, total asset cost depreciates across a series of years.
Asset Accounting Errors – Legal Consequences
Tax authorities, however, provide specific criteria designating which costs can add to asset cost in this way. The requirements, moreover, are legally binding. In 2005, for example, at Worldcom, Inc., a US-based firm, four senior executives were convicted of fraudulent reporting. Worldcom overstepped the boundaries by classifying specific services costs as assets, rather than as expenses, as they should have been. As a result, Worldcom's CEO, CFO, Controller, and Director of General Accounting received lengthy prison sentences.
Tax Authorities Write the Rules
Not surprisingly, each countries tax authorities provide rules and methods for depreciating assets. For in-depth guidance on what qualifies for depreciation, one must, therefore, consult government publications. For example, most of the following are available online and as PDF documents for download:
- Australia: Search Australian Taxation Office Site, https://www.ato.gov.au
for "Guide to Depreciating Assets." - Canada: Search Canada Revenue Agency site,
https://www.cra-arc.gc.ca/menu-eng.html
for "Classes of Depreciable Property." - Ireland: Search Irish tax and Customs site,
https://www.revenue.ie/en/
by each asset class for "Depreciation Guidance." - India: Search Income Tax India site,
https://www.incometaxindia.gov.in/
by asset class for "Depreciation Guidance."
- New Zealand: Search New Zealand Inland Revenue site,
https://www.ird.govt.nz/
for "Depreciation–a Guide for Businesses IR260." - United States: Search the US Internal Revenue services site,
https://www.irs.gov/
for IRS publication 946 "How to Depreciate Property." - United Kingdom: Search UK Govt Revenue & Customs site,
https://www.gov.uk/government/organisations/hm-revenue-customs
by asset class for "Depreciation Guidance."
Cash Flow vs. Depreciation Expense
What Are the Differences?
When a firm buys a long-lasting asset outright, with cash, cash flows at once. Consequently, the full cash cost appears on the current period's financial Cash Flow Statement (Statement of Changes in Financial Position) under "Uses of Cash."
On the Income statement, however, the total expense spans several years or more, across the asset's depreciable life. Note that these depreciation charges are noncash expenses. "Noncash" means that the Income statement charge does not bring a corresponding cash flow anywhere in the accounting system. Businesspeople sometimes ask, therefore: "Is depreciation truly an expense? The answer is "Yes." Depreciation is an "expense" because it fits the accountant's formal definition:
An Expense is a decrease in owner’s equity caused by using up Assets.
Cash purchases can be expenses because they use up cash assets. Depreciation charges are also expenses because they use up asset book value (by accumulating depreciation).
Calculating Depreciation Expense
The Role of Depreciable Life, Cost, Residual Value
The depreciation expense for an asset each year depends typically on four factors:
- Asset Depreciation Life (or Depreciable Life).
- Asset Initial Cost.
- Asset Residual Value (or Salvage Value).
- A Depreciation Schedule for the asset's Depreciation Life.
What is Depreciation Life? And, How Long is Life?
In the practice of asset lifecycle management, depreciation life is just one of four asset lifespans in view:
- First, an asset's Depreciation Life (Depreciable Life) is the number of years over which the asset fully depreciates. For most assets, tax authorities prescribe depreciation lives for different asset classes. In the US, for instance, the government specifies a 5-year life for computing hardware, and depreciation must follow the MACRS (Modified Accelerated Cost Recovery System) schedule.
- Second, an asset's Economic Life is the time during which the asset earns more than it costs to maintain and use it. When an asset is beyond its Economic Life, it is cheaper to replace or scrap it than to continue using it.
- Third, an asset's Service Life is the number of years the asset is actually in use or service.
- Fourth, an asset's Ownership Life is the time over which the asset brings a financial impact of any kind. An asset beyond its Depreciation Life, is still within its ownership life if (a) its residual value still contributes to the firm's asset base, or (b) it will bring further expenses, such as the cost of maintenance, decommissioning or disposal.
Not surprisingly, all four lives can be different for a given asset. For reporting depreciation, only Depreciation Life is especially relevant. However, all four lives are essential considerations in the broader scope of Asset Lifecycle Management.
Depreciation Methods Use
Initial Cost, Depreciable Cost, and Residual Value
Almost all assets enter the Balance sheet asset base with a value equaling their actual cost. The book value of most assets, in other words, conforms with the Historical Cost Convention in accounting.
To calculate depreciation expenses each year, first divide the original cost into two components:
Original Asset Cost = Depreciable Cost + Residual Value
Depreciable Cost is the part of original asset cost subject to depreciation. Residual Value (or Salvage Value), is, in most cases, what owners expect to receive for the asset after full depreciation. In practice, accountants normally derive an asset's original Depreciable Cost from known Residual value and Original Cost figures:
Original Depreciable Cost = Original Cost – Residual Value
Example: Depreciable Cost Decreases Over Time
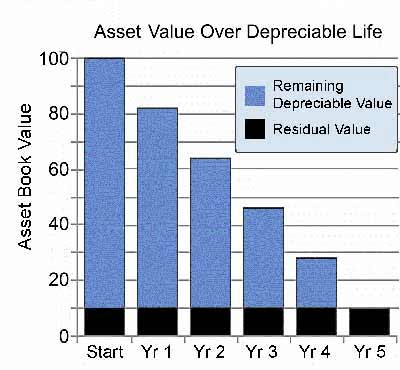
Exhibit 2 shows how the remaining Depreciable Cost decreases over time, leaving only the Residual Value at the end of Depreciation Life. Note that only the depreciable cost component contributes to depreciation expense each year.
Most depreciation schedules apply to the depreciable cost rather than total cost. However, the double declining balance method (DDB) is an exception, as is MACRS, a particular case of DDB Schedules, below, for more on these methods). Under DDB and MACRS, the expense percentages apply instead against total original cost.
When using any schedule besides DDB and MACRS, Residual Value plays a vital role in determining several results:
- Yearly depreciation expenses.
- Tax savings.
- Cash inflow value at the end of depreciation (if any).
Notice two further points on residual value:
- Usually, an asset may not depreciate below its Residual Value.
- If at the end of depreciable life, the firm realizes Salvage Value different from the starting residual value estimate, the firm makes a tax adjustment.
Defining Time-Base Depreciation Schedules
Depreciation Schedules prescribe asset depreciation life and also the depreciation charge for each year. The country's tax laws specify which of these plans apply to various asset classes. Notice, however, that owners sometimes have a few schedule choices.
Straight-line SL Depreciation
Time-Basis Depreciation Schedule
Straight-line Depreciation (SL) is the simplest depreciation schedule. SL depreciation spreads expenses evenly across an asset’s Depreciation Life.
Consider, for instance, a $1,000 asset that depreciates over five years, and has no residual value. Depreciable cost is, therefore, $1,000. Under a 5-year straight-line schedule, owners claim 1/5 of the depreciable cost ($200) as depreciation expense each year.
Other time-based schedules are called Accelerated Schedules because they accelerate depreciation relative to the Straight-Line schedule for the same number of years. Accelerated schedules, therefore, charge relatively more in early years and relatively less in later years. As a result, acceleration enables owners to claim relatively more of an asset's related tax savings early in the asset's depreciation life. Accelerated schedules" below include MACRS, DDB and SOYD methods.
Modified Accelerated Cost Recovery System MACRS is a Time-Basis Depreciation Schedule
Many US companies use the 1986 modification of the 1981 Accelerated Cost Recovery System (ACRS) for specific asset classes. The current version is known as the Modified Accelerated Cost Recovery System or MACRS. This schedule applies only to the United States.
MACRS provides different schedules for depreciation expense for several kinds of assets. Computing equipment falls into the "5-year class" of property, along with most other office equipment and automobiles. MACRS, therefore, calls for a sixty-month depreciable life for computing systems. Depreciation extends across six tax years because the sixty-month period starts at the midpoint of year 1.
There are several variations and options on MACRS schedules, but the primary use applies the double declining balance (DDB) method (see below), starting at the midpoint of year-one. Note that MACRS ignores residual value.
MACRS rules provide two possible schedules for different asset classes: a General Schedule (GDS) which asset owners use frequently used, and an Alternative Schedule (ADS) which is used instead in some cases. A few of the GDS and ADS schedules include:
Office Furniture: GDS 7 Years, ADS 10 Years
Computers: GDS 5 Years, ADS 6 Years
Construction Assets: GDS 5 Years, ADS 6 Years
Railroad cars & Locomotives: GDS 7 Years, ADS 15 Years
For the full set of MACRS schedules and rules for various asset classes, see the US IRS Publication:
Double Declining Balance DDB Depreciation
Time-Basis Depreciation Schedule
The Double Declining Balance Schedule (DDB) is another popular time-basis schedule. The DDB method charges depreciation expense at twice the straight-line rate each year.
The five-year SL rate, for instance, sets annual depreciation expense at 20% of the original depreciable cost. The DDB schedule, however, applies as follows:
- Year 1: The 5-Year DDB method sets first-year depreciation at 40% of the original depreciable cost.
- For year 2, therefore, the depreciable cost is down to 60% of the original depreciable cost. DDB again prescribes 40% of this for depreciation. 40% of 60% is 24%. Year 2 DDB depreciation is thus 24 % of the original cost.
- For year three, only 36% of the original depreciable cost remains. The year three depreciable cost results from the Year two remaining depreciable cost (60%), less 24%, which is 36%. Under DDB, the year three depreciation expense is 40% of 36%, that is, 14%
- And so on. The table in Exhibit 3 below shows that DDB year four depreciation expense is 8.64% of the original depreciable cost, while year five depreciation is 5.18%.
It is easy to see from the line chart in Exhibit 4 that DDB brings the most severe acceleration of the schedules appearing here.
Sum of the Years' Digits SOYD Depreciation
Time-Basis Depreciation Schedule
The Sum-of-the-Years-Digits Schedule (SOYD) is an accelerated method based on a scale of total of digits for the years of Depreciable Life.
For five years of life, for example, the digits "1," "2," "3," "4" and "5" add to produce 15. The first year’s rate becomes 5/15 of the depreciable cost (33.3%), the second year’s rate is 4/15 of that cost (26.7%), while the third year’s rate 3/15, and so on.
Group or Composite Depreciation
Time-Basis Depreciation Schedule
Composite Depreciation is a method for depreciating a group of related assets as a whole rather than individually. This approach can reduce unnecessary record keeping and overly-detailed reporting. As a result, firms often use composite depreciation (or group depreciation) for assets such as office furniture and office equipment.
For an explanation of Composite Depreciation and calculation examples, see the article:
Comparing Depreciation Schedules
Time-Basis Depreciation Schedules
The Exhibit 3 table below compares depreciation percentages for each year for an asset having a 5-year life depreciation life. Figures in the table show percentages of depreciable cost depreciated per year. Acceleration is apparent in the line chart comparison in Exhibit 4, below.
| Schedule | Year 1 | Year 2 | Year 3 | Year 4 | Year 5 | Year 6 |
|---|---|---|---|---|---|---|
| straight-line | 20.00 | 20.00 | 20.00 | 20.00 | 20.00 | — |
| MACRS | 20.00 | 32.00 | 19.20 | 11.52 | 11.52 | 5.76 |
| Double Decl. Bal. | 40.00 | 24.00 | 14.40 | 8.64 | 5.18 | — |
| Sum of Years Digits | 33.33 | 26.67 | 20.00 | 13.33 | 6.67 | — |
Exhibit 3. Comparing 5-year versions of four depreciation schedules. Table values are the percentage of the original depreciable cost to charge for depreciation expense.
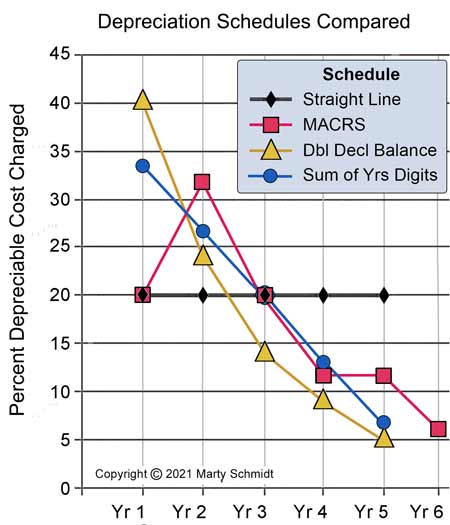
Note that MACRS here refers to a five-year depreciation life that extends across six fiscal years, beginning at the midpoint of year 1.
Depreciation Schedules Not Based on Time
All of the schedules above are Time-Base Schedules because they treat asset life as a specific period, charging a percentage of remaining depreciable cost each year as an expense. Note, however, that tax authorities sometimes allow Usage-Base depreciation instead.
A vehicle under this plan, for instance, might define its life not in years, but in terms of total miles or kilometers driving during its life. The depreciation expense each year would reflect the distance traveled that year as a percentage of the lifetime total. Similarly, other kinds of assets might schedule a life the owners define by a quantity that will be used up. In those cases, the depreciation percentage each year reflects the amount they deplete.
Finding Depreciation Expenses with Excel
Yearly Depreciation Expense by Spreadsheet
Finding the depreciation expense for one asset, each year, is merely a matter of multiplying its depreciable cost by the table-given percentage for that year. Calculating total depreciation expenses can be challenging when the total involves multiple assets and schedules across several years or more.
Consider, for instance building a spreadsheet summary of total depreciation expenses for each of the five years, with the following assets and schedules:
- Asset-A, four-year life, SL schedule, acquired Year-1.
- Asset-B, five-year life, MACRS schedule, acquired Year-2.
- Asset-C, 8eight-year life, DDB schedule, acquired Year-3.
- Asset-D,ten-year life, SL schedule, acquired Year-4.
Calculating total depreciation expense becomes more complex each year:
Year 1 Total depreciation expense:
= (Asset-A depreciable cost ) * ( SL percentage for Year 1 of 4 )
Year 2 Total depreciation expense:
= (Asset-A depreciable cost ) * ( SL percentage for Year 2 of 4 ) +
(Asset-B depreciable cost ) * (MACRS percentage for Year 1 of 6 )
By Year 4, Total expense:
= ( Asset-A depreciable cost ) * ( SL percentage for Year 4 of 4 ) +
( Asset-B depreciable cost ) * ( MACRS percentage for Year 3 of 6 ) +
( Asset-C depreciable cost ) * ( DDB percentage for Year 2 of 8 ) +
( Asset-D depreciable cost ) * ( SL percentage for Year 1 of 10 )
The principles behind these calculations are straightforward. However, the bookkeeping task for the spreadsheet analyst can be tedious and cumbersome. It becomes especially so as the number of years, assets, and schedules increase.
You can review and try out working examples of these calculations across multiple years, in either …
Solution Matrix Ltd® 292 Newbury St Boston MA 02115 USA
Phone +1.617.849.8478 • Contact Form • Privacy Policy • About Us • Sitemap
Terms of Service • Refunds • Customer Service • Safety & Security
Copyright © 2004–2024 by Solution Matrix Ltd • All Rights Reserved

