What Are Assets?
Costly assets must justify their place on the balance sheet by earning returns.
People use the term Asset in everyday speech to refer to property or qualities that have value because they help achieve objectives. In that sense…
- intelligence and good looks are personal assets that help achieve personal objectives.
- Rifles, Tanks, and highly trained soldiers are military assets that help achieve military objectives.
- Some businesses proudly showcase their own employees as "Our most valuable assets" for the same kind of reason.
In business, however, the primary meaning of Asset puts the term in the context of business finance and accounting. however. For accountants and finance officers, Asset has a specific meaning that ties the concept to the firm's financial position in quantitative terms.
Define Asset
(Finance and Accounting)
In accounting and finance, an asset is an item of value the firm owns which…
- The firm acquires at a measurable cost.
- The firm uses in its normal line of business to generate income.
- Carries a book value on the balance sheet.
Primary Meaning: Assets in Finance and Accounting
To accountants, an asset is an item of value the firm owns, which the firm acquires at a measurable cost, uses in its normal line of business to generate income, and carries on the balance sheet with a book value..
- Business people rightly view a firm's assets as investments. Firms acquire assets at a cost, and they expect assets to produce returns that outweigh their costs.
- Accountants record and track asset book value with asset category accounts.Familiar examples include Balance Sheet accounts such as "Cash on Hand," and "Property, Plant, and Equipment."
- The methods a firm uses for acquiring, using, and disposing of assets, together, make up the practice of asset lifecycle management.
- Analysts measure asset earning performance with financial metrics such as return on assets (ROA), inventory turns, and asset turnover. Assets that are not performing well become candidates for disposal or replacement.
Sections below further develop these points, all assuming the accountant's formal asset definition, above. Before moving to these points, however, it is worth noting briefly that business people sometimes say "assets" when they have in mind a much broader meaning.
Second Meaning: Assets as "Valuable Resource"
Many people use the term asset when they simply mean "valuable resource." In this sense, a firm's assets include physical resources such as office furniture and computer systems, of course, but also non-physical resources such as employee skills and a strong brand image.
Business firms sometimes issue public relations statements such as these: "Our employees are our greatest assets." Or, "Loyal customers are this firm's most valuable assets." When businesspeople use the term asset in this second, broader sense, certainly not all the resources in view qualify for the accountant's Balance Sheet.
Nevertheless, astute managers fully scope the broadly-defined asset base and try to understand the business value of every important resource. Astute directors and officers expect senior managers to make the best use of all assets, on or off the Balance Sheet.
Explaining Assets and Lifecycle Management in Context
Sections below further explain Asset in context with related concepts from asset management, accounting, and finance, emphasizing four themes:
- First, Asset as an accounting term and Balance Sheet category.
- Second, reporting Assets on financial statements and measuring asset performance with financial statement metrics.
- Third, the nature of Asset accounts and example Asset-account transactions.
- Fourth, the purpose and approaches of Asset Life Cycle management.
Contents
- What are assets?
- Understanding the asset base: Start with the Balance Sheet.
- The Asset base as an investment portfolio.
- What is asset lifecycle management?
- Tangible vs. Intangible Assets: Do both belong on the Balance Sheet?
- What are major asset account categories?
- Where do asset accounts appear on the Income statement and Balance Sheet?
- Which financial metrics focus on asset performance?
- Does the firm have assets it needs to operate and grow?
- Does the firm use assets efficiently?
- Are the firm's asset investments profitable?
Related Topics
- For more on building and analyzing the asset base, see Asset Structure.
- See the article Capital Review Process for more on asset planning and asset acquisition.
Understand the Asset Base
Start With the Balance Sheet
The balance sheet is a high-level snapshot of a firm's asset structure and the book value of its asset accounts—as well as the full scope of the firm's liabilities and equities. For this reason, the balance sheet is an excellent starting point for building an understanding of a firm's asset base.
Assets Should Earn Returns
Owners expect assets to earn returns throughout their lives in service on the balance sheet. Assets that do not or will not earn returns become candidates for disposal.
- In construction industries, for instance, heavy equipment that sits idle for long periods fits this description.
- In transportation industries, costly assets such as aircraft and delivery vehicles are normally in service or maintenance around the clock, to maximize asset returns.
Company management and stockholders expect assets to justify their place on the Balance Sheet by producing value for the company that exceeds their cost. Financial statement metrics such as Inventory Turns, Total Asset Turnover, or Return on Assets (ROA) use Income statement and balance sheet figures to measure the company's efficiency and productivity in using assets.
The Balance Sheet Always Balances
The firm's Asset accounts and their end-of-period balances make up one "side" of the balance sheet, while the entire sheet is simply a detailed instance of the so-called Balance Sheet Equation:
- Assets are resources the entity uses for earning income.
- Liabilities are what the entity owes.
- Equities are what the entity owns outright.
Most firms in private industry practice accrual accounting with a double-entry accounting system. With this approach, the balance between Assets, on the left, and Liabilities + Equities, on the right, always holds. Double-entry rules ensure that a change to an account in any category (Assets, Liabilities, or Equities) brings an equal offsetting change to one or more other accounts, restoring the balance.
- If the firm buys a production machine with $2,000 cash, it credits (decreases) an Asset account "Cash" by $2,000 while debiting (increasing) another Asset account "Production machinery" by the same $2,000. In this case, the overall Assets total does not change, and the balance sheet balance holds.
- If instead, the firm takes a $2,000 bank loan for the same purchase, it credits (increases) a Liabilities account "Bank Loans" by $2,000. At the same time, it debits (increases) the Asset account "Production Machinery" by $2,000. Adding $2,000 to both sides of the Balance Sheet equation in this way maintains the balance.
The Balance Sheet Reveals Asset, Capital, and Financial Structures
Exhibit 1, below shows how the Balance Sheet components define three of the firm's structures: Asset Structure, Capital Structure, and b. Green, blue, and red borders in Exhibit 1 show that each structure represents a group of Balance Sheet accounts.
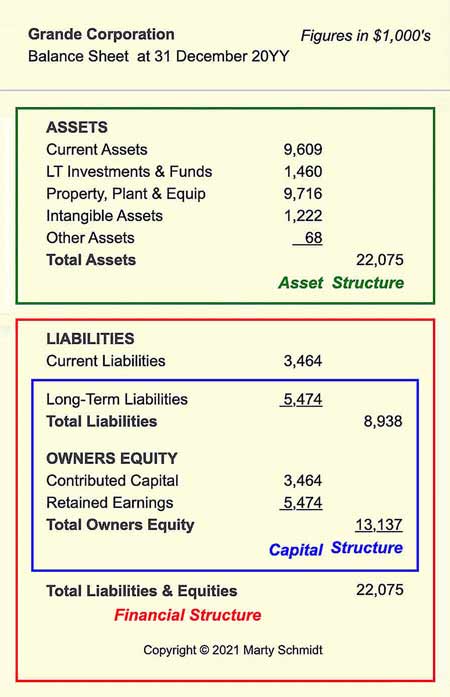
Exhibit 1 above shows the book value magnitudes of five asset categories. However, the essence of an asset structure lies in the relative magnitudes of book value totals, rather than the magnitudes by themselves.
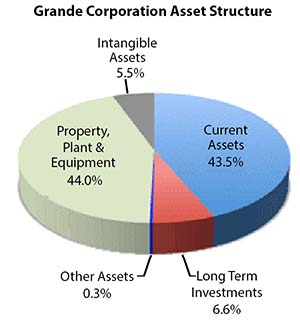
Exhibit 2 below recasts the tabular data from Exhibit 1 into chart form, making it easier to grasp the relative sizes of five asset categories. Here, for instance, Property, Plant, and Equipment category assets ($9,716,000) account for 44.0% of the total asset base ($22,075,000).
The Asset Base as Investment Portfolio
Directors and owners of public companies hold the firm's officers and senior managers responsible—above all—for earning, growing, and maximizing profits. They expect profits, moreover, in the firm's core line of business. Officers and managers try to meet these responsibilities by developing strategies for pursuing profits. Here, strategy builders succeed when they understand they are truly acting as investment portfolio managers.
In this sense,
- The asset base is a collection of investments.
- Each asset category is a different class (or kind) of investment.
- The five asset classes in Grande's asset structure represent the firm's complete asset investment portfolio.
The mandate to deliver maximum profits can now be re-stated as the portfolio manager's mandate to maximize returns from an entire investment portfolio.
Different Asset Structures for Different Industries
In pursuing profits, different portfolio structures (Asset Structures) perform best in different industries.
- Grande, for instance, has an Asset Structure that performs well for companies in heavy manufacturing. Grande invests heavily in Property Plant and Equipment (44.6% of the asset base) and Current Assets (43.5 % of the base).
For companies in heavy manufacturing, incidentally, the greatest part of the Current Assets investment normally consists of inventories—Raw Materials, Work in Progress, and Finished Goods inventories. - The same asset structure would perform very poorly, however, for firms in certain other industries. Companies in Financial Services, for instance, may invest very lightly in Property Plant and Equipment.
These firms typically maximize asset portfolio performance by investing heavily in Long-term Securities and certain other Current Assets, such as Marketable Securities and short-term Investments.
Further resources on Asset, Capital, and Financial structures
- See the section below, Financial Metrics with an Asset Focus for more on measuring asset efficiency and productivity.
- For more on asset structures in different industries and strategies for optimizing asset structure for maximum ROA, see Asset Structure.
- For more on Capital and Financial structures, and the role of structures in creating leverage, see Capital and Financial Structure.
What is Asset Lifecycle Management?
The entire practice of acquiring, using, and disposing of assets is known as asset lifecycle management. The specific activities and methods that asset managers use differ among different kinds of assets. Generally, however, those responsible for managing assets try to use best-practice methods for pursuing the following objectives:
- Ensure assets are available where and when the firm needs them.
- Minimize the risk of asset failure.
- Maximize the return (gains) from assets.
- Ensure that the firm uses assets productively throughout their economic lives.
- Assets must not be wasted or allowed to sit idle.
- Asset managers may need to work with other managers to improve or processes that impact asset utilization and productivity.
- Sell or otherwise divest assets that are idle or unproductive.
- Set priorities for acquiring assets, replacing assets, and planning future expansion or reduction of the asset base.
Reaching Asset Base Objectives
Reaching these objectives requires an excellent knowledge of asset…
- Expected gains or returns.
- Asset managers must know specifically how each assets class contributes to meeting business objectives for operational performance.
- Asset managers must also understand asset lifecycle total cost of ownership
- Advancements and the current state of technology. The need for current technical knowledge is critical when assets include computing and communications technology, but it is also important for:
- Other kinds of assets using technologies that are evolving or changing, such as medical or laboratory equipment.
- Assets subject to changing requirements for fuel efficiency or emissions.
- Reliability and availability risks.
- Available choices in leasing vs. buying, and the implications of each choice for:
- Upgrade or replacement flexibility.
- Responsibility for maintenance.
- Position either on or off the balance sheet.
- Potential tax liabilities and tax savings.
- Asset depreciation life, economic life, and service life.
- Appropriate depreciation methods for each asset class.
- Fair market value and replacement cost.
- Residual value at the end of depreciation life.
Tangible vs. Intangible Assets
Do All Belong on the Balance Sheet?
Accountants classify assets first as either tangible or intangible assets. The distinction impacts the way they report, track, value, and expense (depreciate or amortize) these assets.
What Are Tangible Assets?
A tangible asset is an item with physical substance, such as land, buildings, computers, or cash. "Tangible" simply means the asset exists as something "touchable.".
Accountants view certain kinds of assets as tangible, even though they may seem at first to have no physical substance. Familiar examples include:
- Cash funds in bank accounts. Such funds are tangible, even though they exist only as account records in the bank's accounting system.
- The firm's Accounts receivable funds. These are tangible Current Assets, even though they exist only as debt records that customers currently owe to the firm.
- Purchased software programs. These are tangible Long-term Assets, even when they exist only as information in computer memory.
What Are Intangible Assets?
An intangible asset, like all other assets, is an item of value the entity acquires at measurable cost and uses to generate income in its normal line of business. The intangible kind, however, have no physical substance and are by definition not "touchable." Typical examples include:
- Purchasing the right to use a patent, copyright, or trademark that another firm owns.
- The right to use another firm's logo and brand name. Such rights normally go with the purchase of an operating franchise by one firm from another.
Even though they have no physical substance, intangible assets can and often do appear on the Balance Sheet. However, a specific asset's eligibility for the balance sheet depends on factors such as these:
- How the firm acquires the intangible asset.
- Whether the asset is a legal intangible or a competitive intangible.
- Whether asset ownership has a limited life or indefinite life.
Acquiring Assets: Purchasing intangibles vs.. Creating Intangibles Internally
A patent (the intangible), for instance, might result from the company's own internal research and development activities. Alternatively, the firm might purchase the right to use a patented design from another owner.
By accounting standards (such as GAAP), purchased intangibles are usually easier to value and include in financial reports than are intangibles that firms develop internally. Intangibles that firms develop internally are generally not subject to depreciation.
Logos and Brand Names as Intangible Assets
Logos and brand names that firms such as Coca-Cola, Georgio Armani, and Apple own are arguably "valuable resources" for the companies that own them. Nevertheless, these specific logos and brands do not qualify as intangible assets for the Balance Sheet because their owners create them over time—they do not buy them outright.
By contrast, the purchaser of an operating franchise, such as a franchise holder with Domino's Pizza, or McDonalds, can list the franchise brand name and logo as intangible assets on the franchise owners Balance Sheet. This is because the use of they purchase these assets at a measurable cost for use across a specific time period.
Legal Intangibles vs.. Competitive Intangibles
Businesspeople sometimes refer to Legal intangibles as intellectual property. These may include such things as trade secrets, proprietary knowledge (for example, a proprietary soft drink formula), patents, trademarks, and copyrights. Intellectual property rights for such things are legally defensible in courts of law.
On the other hand, competitive intangibles are intangibles that enable the company to compete effectively. These may range from such things as human capital—the skill and experience of the company's employees—to company reputation or brand recognition. Competitive intangibles may also include collaborative activities and business partnership agreements. Such competitive intangibles are generally not legally defensible in court.
Limited Life Intangibles vs.. Indefinite Life Intangibles
A company's brand recognition (a competitive intangible) is usually , also, an indefinite life intangible. This is because it will probably remain with the company indefinitely. By contrast, when a company purchases a right to use a patent or brand name for a specific period of time, the intangible (right to use the patent) is a limited life intangible.
Major Asset Categories on the Balance Sheet
Balance sheets generally do not list individual asset items. They would do this only if a single asset item had an asset account of its own in the accounting system, and then only if that represents more than a few percent of the total asset base. As a result, asset names on the Balance Sheet usually do not identify individual asset items, but rather, they represent the following:
- Individual asset accounts such as Raw Materials Inventory.
- Asset account groups, such as Current Assets.
Balance sheet asset listings, in other words, must represent the firm's own Chart of Accounts. And, because there is no single standard Chart of Accounts, it follows that there is no single standard list of asset categories.
Nevertheless, this section presents some of the more familiar asset categories. Exhibit 5 below is an example balance sheet with a very large set of asset accounts and account categories (see the Balance Sheet Example, below).
Current vs. Long-term Assets
Major asset account categories for balance sheet reporting appear below. Most companies begin asset classification with two high-level categories;
- Current assets (or short-term assets): Assets with a life expectance less than one year,
- Long-term assets: Assets with an indefinite life expectancy, or a life expectancy of at least one year or more.
Generally Accepted Accounting Principles (GAAP) in most places require that long and short-term assets list separately. That is, Long and short-term assets do not combine in a single Balance Sheet item. Beyond this, however, there is room for flexibility and individuality in the application of asset class names.
- The categories below, for instance, are not necessarily mutually exclusive. Some assets may qualify for listing under several classes listed below, such as Capital Assets, Property Plant and Equipment, or Fixed Assets.
- Some companies choose to report asset categories by naming a kind of asset, such as Store Equipment, Computer Systems, or Delivery Fleet Vehicles."
With these considerations in mind, familiar Balance Sheet asset categories (account categories) include the following:
Current Assets
Current assets are so-named because they include cash and other items that the firm could convert into cash or use up in the near future, usually within a year. Accounts Receivable and Finished Goods Inventory, for this reason, normally appear under Current Assets. Other kinds of current accounts may include short-term Notes Receivable, Prepaid Expenses, Prepaid Taxes, and Deferred Taxes.
Figures for balance sheet Current Asset items contribute to asset-focused liquidity metrics. These metrics include acid-test ratio, current ratio, and working capital.
Long-term Assets
Long-term assets are assets that will remain on the balance sheet for a year or more. These assets typically include Capital Assets, Fixed Assets, and Property, Plant and Equipment assets.
Figures for Long-term items from the balance sheet contribute to asset-focused investment and valuation metrics for the company, such as Return on Total Assets ROA, and Total Asset Turnover.
Capital assets
The term Capital Asset is sometimes interchangeable with Fixed Asset. A capital item is long-lived and usually tangible. Capital asset items:
- Appear on the company’s balance sheet (they are "Capitalized"),
- Are usually paid for out of a Capital Budget,
- Receive approval for puhase through a Capital Review Process.
In order to qualify as a capital resource, the item must have an acquisition cost above a specific value, and it must require a useful life of more than one year.
In Balance Sheet accounting, capital items are reported separately from Current assets. Fixed items are considered less liquid than Current items because capital items would be more difficult to convert into cash in the short-term.
Fixed Assets
The term Fixed Asset is sometimes interchangeable with Capital Asset or Non Current Assets. These are tangible resources that a corporation or another entity owns, that they do not use up, consume, or convert into cash during normal business operations.
Factory machinery, buildings, and large computer systems are typical Fixed Asset items. In balance sheet accounting, firms report capital and/or Fixed tems separately from Current items, sometimes in a category called Property, Plant and Equipment.
Wasting Assets
Wasting assets include items that owners can "use up," as well as other items that otherwise lose value after a specific time .Those in the first category include natural resources, such as timber, or oil, which owners consume or use up in the course of business. Assets in the second category include stock options which either expire at a certain date or, due to changing market conditions, become worthless (become "out of the money").
Intangible Assets
An intangible asset, as the section above explains, is an item of value the firm owns or controls, which the firm acquired at a measurable cost. Unlike the physical assets described in this section, however, Intangible assets have no physical substance and are by definition not "touchable." Monetary items such as cash or accounts receivable are generally not included in this category .
Even though they have no physical substance, intangible assets can and often do appear on the Balance Sheet. Those eligible for the Balance Sheet may include a purchased right to use:
- Patents, copyrights, trademarks, or proprietary intellectual property.
- Another company's logo or brand name. This can occur when a business purchases a franchise to operate under another firm's name.
Assets on Income Statement and Balance Sheet
The acquisition and use of assets impacts both the company's Income statement and Balance Sheet reports.
Assets on the Income Statement
An asset's full purchase cost generally does not go onto the Income statement as an expense item, at least not all in one year. Instead, the accounting practice of depreciation provides a way to account for the purchase of long-lasting items over a period of years.
The idea is that these items have a useful life (depreciation life), over which they wear out or use up their value, and that the owner receives the tax benefits of paying for these items over those years instead of all at once. Each year of the useful life, owners charge a certain percentage of the purchase price against income as a depreciation expense. Tax authorities provide depreciation schedules that specify depreciation rates and depreciation lives for different asset classes. These lower the income the company reports across a number of years, thereby creating a tax saviings for the company.
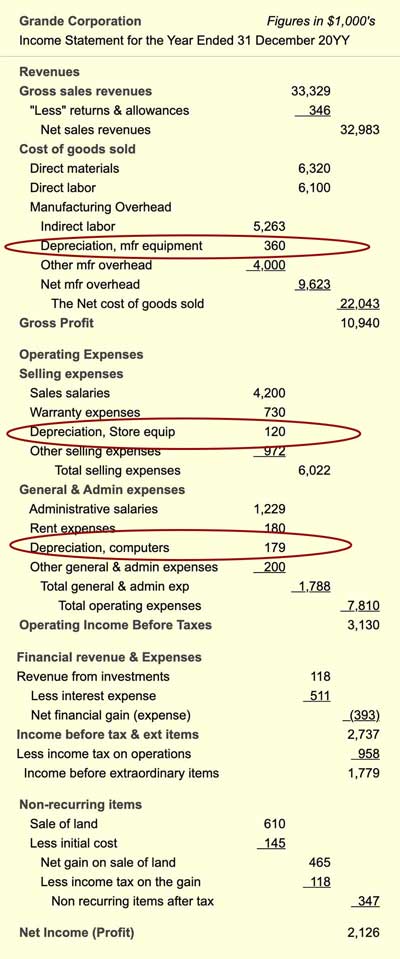
The example Income statement below (Exhibit 5) shows how depreciation expense can appear on an Income statement. For a more complete coverage of the subject, see Depreciation.
Assets on the Balance Sheet
The Balance Sheet reports book values of the company's assets. For most items, this is the acquisition cost less its cumulative depreciation through the end of the current year of depreciation life. Each year of depreciation life, asset book value decreases by the amount of depreciation (or amortization) expense, until it reaches its residual value.
The example Balance Sheet below (Exhibit 5) shows how Accumulating Depreciation expense for several asset classes results in a balance sheet book value lower than the original cost.
Financial Statement Impacts
The financial statement impacts above refer most directly to situations involving capital and fixed items. Note that the other categories of assets may also create Income statement expenses and have their book value decrease annually, but with some differences:
- For intangibles with a limited life (e.g., the purchased right to use a patent for a certain time), the process of reducing book value and charging an expense against income is amortization instead of depreciation. Amortization expenses of this kind usually calculate with the straight-line method across the amortization life.
- Indefinite intangible assets may also create an Income statement expense, sometimes, and reduce book value accordingly. In this case, however, owners must validate the reduction in value by probing, or testing the current value.
Damage to a company's brand recognition (when that is on the balance sheet as an indefinite intangible) would represent such an impact, if the firm can prove damage to the company's ability to compete. - Generally, business firms do not depreciate current assets (including primarily Cash, Accounts Receivables, and Inventories) .
- Land and other real estate assets are generally not subject to depreciation.
- Wasting items may sometimes depreciate according to a usage-basis depreciation schedule rather than a time-basis schedule. That is, depreciation expense each year is as a percentage of acquisition, estimated as the percentage used up or depleted during the reporting period.
For a broader discussion of the structure of a company's base in these categories, see the encyclopedia entry asset structure.
Example Income Statement
Asset Depreciation on the Income Statement
Depreciation expenses appears on the Income statement in positions that depend on where and how the firm uses the specific assets.
- Product production assets, for instance, contribute depreciation expense to cost of goods sold and thereby impact Gross Profit.
- Below the gross profit line, assets used in selling (e.g., store equipment) appear under "Selling Expense.
- Assets used for general administrative purposes (such as computer systems) appear under "General and Administrative Expenses."
Exhibit 4 below shows asset depreciation expenses in three categories, one above the Gross Profit line, and two below the Gross Profit line.
Example Balance Sheet
Asset Depreciation on the Balance Sheet
Balance Sheets sometimes list asset groups as general asset categories, (e.g., Current Assets). However, they can also identify asset categories in terms of how they use the assets (e.g., Store Equipment), and sometimes simply in terms of what the items are (e.g., Computer systems).
Exhibit 5 below shows how Grande Corporation reports assets in a number of different categories.


Asset-Focused Financial Metrics
Business Ratios for Asset Questions
Management and investors will want assurance that the company has the assets it needs to operate and grow. They will also seek assurance that the company is using assets efficiently and productively.
To address these issues, analysts turn to financial statement metrics that attempt to measure the company's resources and their utilization.
Asset Question 1
Does the Firm Have Assets It Needs?
One way to address this question is through so-called liquidity metrics, which focus on the short-term. The three most familiar liquidity metrics are Working Capital, Current Ratio, and the Quick Ratio (Acid-Test Ratio). All three take their input data from Balance Sheet entries (for the example Balance Sheet with these entries, see the Sample Balance Sheet in Exhibit 5, above).
The Working Capital Metric
Working capital is a figure in currency units such as dollars, pounds, euro, or Yen. showing the difference between current resources and current obligations:
Working capital = Current assets – Current liabilities
= $9,609 – $5986 = $3,623
How much working capital is sufficient? Company management will attempt to address that question by projecting their current liabilities for the next year as well as the cash inflows they expect for the next year.
Current Ratio
The current ratio metric results from the same input data as the working capital metric, except that here the metric is the ratio of Current Assets over Current Liabilities:
Current ratio = Current Assets / Current Liabilities
= $9,609 / $5986 = 1.61
This company's current ratio may be cause for concern, ecause a current ratio value of 2.0 is a generally used "rule of thumb" requirement for healthy liquidity, while a Ccrrent ratio under 1.0 is usually a cause for alarm.
Quick ratio / Acid-Test ratio
The most severe liquidity test of the three appearing here is the Quick Ratio, or Acid-Test Ratio. This ratio is similar to the Current Rtio, except that the Inventories figure is subtracted from the "Current" total before performing division. The idea is that inventories are the least liquid of the current components:
Quick ratio = (Current Assets – Inventories) / (Current Liabilities)
= ($9,609 – $3,464) / $5986 = 1.03
Here, too, this company's acid-test ratio might be cause for concern. Analysts generally consider an acid-test ratio of about 1.1 as a minimum healthy level.
Asset Question 2
Does the Firm Use Assets Efficiently?
Activity and efficiency metrics such as Inventory Turns and Total Asset Turnover address this question by computing ratios from Income statement and Balance Sheet data.
Inventory Turns
Inventories, like other assets are supposed to produce returns and not sit idle or unproductive. The inventory turns metric uses an Income statement item (Net Sales Revenues) and a balance sheet item (Inventories) to approximate the number of times per year the company "turns" over its inventories.
Most businesses generally prefer a higher number of turns for the year over a lower number for two reasons:
- First, inventory storage and care can be costly. Removing items from inventory usually means completely means the company sold them..
- Second, inventories tie up funds that might otherwise contribute to other means of producing revenue.
For this example, assume that Grande Corporation's net sales revenues for the year were $32,983 and that its balance sheet entry for total inventories was $5,986.
Inventory Turns = (Net Sales Revenues) / (Inventories)
= $32,986 / $5,986 = 5.5 turns / year
Management may set specific target turn rates, and it is easy to calculate the value of reaching these targets.
Total Asset Turnover
Companies acquire resources for the purpose of generating revenues. Total asset turnover compares directly the revenue "returns" from the company's resources, to the book value of these resources. The higher the turnover rate, the shorter the time it takes for these resources to generate their own value in sales. This example uses the same net sales figure ($32,983) as the previous, along with the sample balance sheet total assets figure of $22,075.
Total asset turnover = (Net Sales Revenues) / (Total Assets)
= $32,983 / $22,075 = 1.49 turns/year
If the company's turn rate is out of line with industry standards, analysts will want to know why. (Companies in the same industry sometimes do have quite different business models, and this could account for the difference between one company's metrics and the rest of the industry.
Asset Question 3
Are Asset Investments Profitable?
Are asset investments profitable? This question points to the highest level company performance metric in the DuPont System of Analysis.1 And, obtaining an answer to this question represents the primary objective for those who approach asset management as an exercise in investment portfolio optimization. The primary metric for this purpose is the profitability metric Return on Total Assets, ROA.
Return on Total Assets (ROA)
The most wide-ranging asset-focused metric is Return on Total Assets (ROA). ROA is simply the company's net income for the year (bottom line of the Income statement) divided by total assets from the balance sheet.
Assuming that Grande Corporation reported a net income (profit after taxes) of $2,126 for the year, and the balance sheet total assets were $22,075, ROA is:
ROA = (Net Income) / (Total Assets)
= $2,126 / $22,075 = 9.6%
Investors and senior management will compare this ROA with other companies in the same industry, with year to year changes in this company's ROA, and with other opportunities for earning returns from the same value resources.
For more on asset-focus financial metrics, including Return on Assets ROA and the DuPont System, see the Excel-based ebook Financial Metrics Pro.

