What Are Sales Revenues?
Business firms often define goals for growth, market share, and market position in terms of to sales revenues.
Define Sales Revenues
In private industry and commerce, Sales Revenues are funds that buyers owe and pay sellers for the purchase of goods and services. The term "Sales Revenues" generally means the same thing as its shorter form, Sales.
In Europe, the term Turnover sometimes serves as a synonym for Sales Revenues.
When the firm's core business is selling goods and services, sales revenues stand at the top of the Income statement. For each accounting period, the Income statement bottom line—profit—is what remains after adding all other revenues and subtracting all other all expenses.
Sales Revenue Figures Point to a Specific Time Period
Businesspeople sometimes describe companies informally with a single currency figure, for example:
- "That is a $15 billion company."
- "The company has grown into a € 100 million business."
Given these statements, businesspeople understand instinctively that the currency figure refers to sales revenues for the most recently reported year. However, the formal reports themselves, always do identify the time span. Public companies, for instance, usually announce revenue results this way after every fiscal quarter.
Businesspeople generally view sales revenues—along with profits—as the most basic and the most useful measures of company financial performance and growth. Sales revenues, moreover, are the starting point for calculating other important metrics, including gross profit, operating profit, and net profit.
Revenues From Multiple Sources
At the end of each reporting period, firms may report incoming revenues from multiple sources. Some companies highlight individual lines of business separately as, for instance, firms that report Product Revenues separately from Services Revenues. They are especially likely to do so when different lines of business are growing at different rates or earning different margins.


Multiple revenue lines can nevertheless appear together at the top of the Income statement, as long as they represent parts of the company's core business. In this way, only revenues from the core business impact the gross profit and operating profit results below.
Ultimately, however, all of the period's revenues must enter the Income statement, including those from sources outside the core business. Firms that sell goods or services report other revenues below the operating profit line. These may include items such as "Revenues from Financial Investments" or "Revenues from Asset Sales. And, all "revenues," above and below "operating profit," impact bottom line Net Profit.
Revenues for Government Organizations
Note that for government organizations, the term Revenue refers to funds flowing into the government from all sources, including especially taxes they collect.
In English speaking countries, the highest taxing authority for a national government, or for a state, or for a province, usually carries a name that includes "Revenue. " For example:
- Inland Revenue (UK, Ireland, New Zealand, Australia)
- Internal Revenue (United States)
- Revenue Agency (Canada).
Explaining sales revenues in context
This article further explains and explains revenues and sales revenues in context with terms, emphasizing three themes:
- First, defining Sales Revenues as incoming funds from sales of goods or service, which—in private industry—ultimately create profits.
- Second, Sales Revenues in Financial Reporting and their role in creating margins and profits.
- Third, Sales Revenue growth and its role as a core metric for measuring business growth.
Contents and Resources
What Exactly Does Earning Revenues Mean?
Define Your Terms!
The question of when, precisely, the firm earns specific revenues is essential for accounting purposes. Accounting standards everywhere mandate that firms report revenues in the accounting period they "earn" them.
Revenue Timing Depends on the Accounting System.
Small shops and other business firms that use cash-basis accounting earn revenues when customers pay them for goods or services, with cash. A cash-basis system, in fact, recognizes only two kinds of transactions: (1) Cash inflows—which include revenues earnings, and (2) Cash outflows, which include expenses the firm pays. For these firms, earning revenues means, mostly, getting paid.
However, the vast majority of business firms, worldwide, practice instead accrual accounting with a double-entry accounting system. For all but the smallest and simplest firms, and for public companies of all kinds, it is just impossible to meet recordkeeping and reporting requirements using cash-basis accounting alone. For firms using accrual accounting, the question of "when" they earn revenues becomes a little more complicated.
Accrual-Base Firms Claim Revenues
When They Meet Two Conditions
Under accrual accounting, every sales transaction has two events. One event is the delivery of goods or services by the seller, and the other is customer payment. Accrual accounting recognizes, further, that either event may precede the other and that there may be a time lapse between them. As a result, it is possible for sellers to earn revenues before customers pay, and it is also possible for customers to pay before the seller earns the "revenue." Earning revenues, in other words, does not depend on customer payment.
With an accrual-based system, sellers instead earn revenues only after they deliver goods or services to the customer. However, there is a second condition that must be met, as well, for the seller to claim and report revenues as earnings. Sellers can claim revenue earnings only if the recognize revenues as realizable. Realizable merely means that the seller has good reason to assume that the customer will pay.
Business Firms Report Revenues When They Earn Them
It is customary for customers to pay in advance for some kinds of services. In such cases, the seller does not claim "Sales revenues" earnings until the seller delivers the services.
Consider, for instance, a computer user buying a one-year subscription to an online backup service. Customers usually pay these subscriptions in advance. When the customer submits the advance payment transaction, the service provider has realized revenues, immediately, but the seller also classifies the same revenues initially as unearned revenues (a liability). As the customer uses the service, month by month, the seller transfers funds from the liability account "Unearned Revenues" to the revenue account "Sales Revenues." (See the article "Unearned Revenues" for more on the bookkeeping transactions involved with unearned revenues.
Gross Sales Revenues vs. Net Sales Revenues
What Are the Differences?
In finance and accounting, "Net Sales Revenues" refers to the incoming revenues a company claims for selling goods and services in its regular line of business during an accounting period (usual
Firms distinguish between Net sales revenues and Gross Sales Revenues, which may also appear on the Income statement. If, for instance, the company sells 100 units of an item having a list price of $10, Gross sales revenues are 100 x $10, or $1,000.
Net sales revenues, however, may be less. The company may not receive (or, customers may not owe) the full Gross sales revenues figure.
- After purchase, customers may return goods for a refund, thus reducing the net sales revenues.
- Customers may ask for an allowance, effectively a price reduction, for such things as minor defects found in the goods after purchase, thus reducing net sales revenues.
- Business firms sometimes grant discounts to specific customers. "Discounts" allow them to purchase at prices below the list price, thus reducing net sales revenues.
In other words:
Net sales = Gross sales – Returns, Allowances, and Discounts.
Some firms choose to include the "Gross Sales Revenues" line, while others choose to omit it entirely. In any case, the "Gross Sales" figures are not necessary. Business planning and business analysis concern primarily Net sales, not Gross sales.
Example income Statement
Including Revenues, Expenses, and Profits
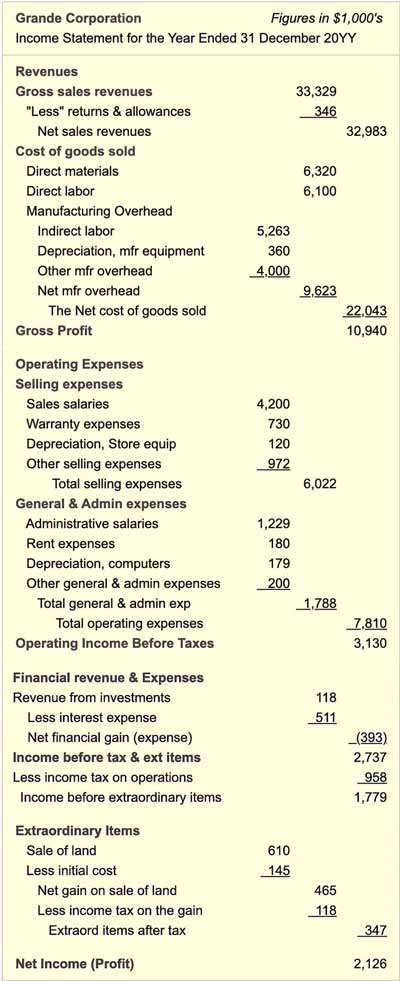
Sales revenues sit at the top of the Income statement. Exhibit 2, below, shows in detail how revenue and expense figures add and subtract so that the full statement represents the Income Statement Equation:
Income = Revenues – Expenses.
Which Revenue Line is the Real "Top Line" of the Income Statement?
Before moving to Exhibit 2, however, it is worth considering a few lines near the top of the statement, as shown in Exhibit 1. Note especially that the report, in fact, begins with two Sales revenue lines: Gross sales revenues, and Net sales revenues.
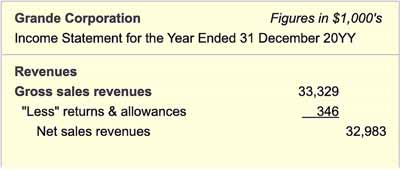
The section above, immediately after the Table of Contents, explains the differences between Gross and Net sales revenues. Firms that choose to include the Gross sales figure have their reasons for doing so, but It is important to remember that Profits and Margins calculate from the Net sales, not Gross sales.
Income Statement Structure and Contents
The example statement below might represent a manufacturing company, but the general form and significant categories are typical for companies across a wide range of industries. A company that sells services rather than manufactured goods might report "Cost of services" rather than "Cost of goods sold." Aside from a few such minor differences in terms, the Income statement structure and contents in Exhibit 2 are nearly universal.
Income = Revenues – Expenses.

Income = Revenues – Expenses.
Five Expense Categories On the Income Statement
Notice that expenses fall into five major categories. The first three categories represent expenses that come from the company's core line or lines of business:
- Cost of Goods Sold.
The costs of producing goods or services. - Operating Expenses—Selling Expenses.
The costs of selling the goods or services. - Operating Expenses—General and Administrative Expenses.
Overhead, support, and management costs from across the company.
Note that depreciation expenses may appear in each of these categories, depending on the use of the assets in question.
The remaining two major expense categories refer to both gains and losses from activities that are not in the company's core line of business. This company is not, for instance, in the financial services, or financial investing, or lending business. The company is also not in the real estate business. The firm reports financial transactions in these latter areas separately from the areas that contribute to core business operating income.
- Financial Revenues and Expenses.
Revenues from invested funds, costs of financing borrowing. - Extraordinary or One-Time Items.
Substantial gains or losses from selling assets or restructuring actions.
How Do Firms Predict & Measure Revenue Growth?
Potential investors who are considering buying shares of a company's stock will consider carefully the company's ability to grow sales revenues and grow profits.
- Profit growth is essential to investors because, in principle, profit-making companies exist and operate primarily to create value for their shareholder owners.
Public companies increase owner value by earning profits. The firm either (1) keeps profits as retained earnings (thus growing Owners Equity on the Balance Sheet), or (2) distributes them directly to shareholders as dividends. Dividends are a more immediate and direct way to increase shareholder value. - Sales revenue growth is essential to investors for at least two reasons.
- First, at least some sustained revenue growth is necessary to maintain or grow profits: inflation will increase the company's costs from year to year, and cost increases must be accompanied by revenue increases, even to hold on to consistent profits.
- Second, in a growing economy, a lack of growth in sales revenues probably means the company is not gaining market share over its competitors and is not attracting new customers.
Predicting sales revenue growth is also crucial to the company management, for obvious reasons: the planning of next year's production, product development, inventory levels, marketing programs, hiring, and budgeting of all kinds, depend heavily on what the company expects in sales revenues.
One sales revenue metric that serves both investors and management in this regard is the company's cumulative average growth rate (CAGR) in sales revenues. CAGR looks to a starting sales revenue figure (perhaps for "Year 1") and a later sales revenue figure (a later sales revenue figure (such as for "Year 10"), and asks: What is the average growth rate, per period?
If, for instance, sales revenues for "Year 1" were 10 million, and sales revenues for "Year 10" were 100 million, what was the average growth rate per year? Remember that compound interest growth is involved. In the nine years of growth, sales revenues increased ten-fold, to a level of 1000% over the initial sales revenue figure. However, because of compounding, the average growth per year is not 1000% divided by 9. If that were the case, growth per year would have been 111% per year—but that is the wrong answer to the growth question.
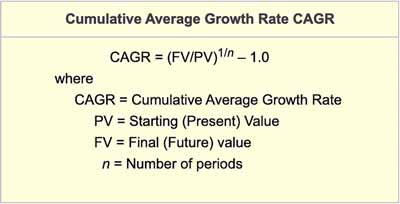

For this example, the starting value (PV) is 10 million, and the Final Value is 100 million. The number of compounding periods, n (years in this case), is 10 – 1, or 9.
The CAGR formula computes this example as follows:
CAGR = (100/10)1/9– 1.0 = 29.2% growth per year
Three Kinds of Margins and Profits
Gross, Operating, and Bottom Line Net Profit
Bottom line net income is a measure of the company's financial performance for the period. However, the Income Statement contains other performance metrics as well. The difference between net sales revenues and cost of goods sold is called Gross profits, for instance, while the net income from operations—before taxes and before gains and losses from financial and extraordinary items—is called operating income (or operating profits).
All three of the profit lines from the Income Statement (gross profit, operating profit, and bottom line net profit) appear as percentages of net sales, that is, as margins. Gross margin, for instance, is gross profit divided by net sales, as Exhibit 4 below shows.
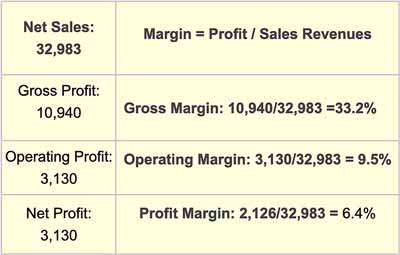
Margins, in turn, are very significant indicators of a company's performance for stock market analysts and the company's management.
- Analysts will compare the company's margin percentages directly with margins from competitors and with industry "best in class" standards. They will consider not only the current margins but also period-to-period trends in margins.
- The company's management attention will focus on margins for several reasons:
First, margins are central to the company's business model. Margins in the model, that is, show exactly where the company expects to make money.
Secondly, management will watch closely year-to-year changes in margins. Margins are highly sensitive indicators of the company's ability to compete effectively and reach objectives in its business plan.
Thirdly, margins for individual product lines and even specific products are central to management planning and decision support for product portfolio management. The Income Statement shows the gross margin for the company, for instance, but underneath the company average gross margin (and shielded from competitors and public eyes), each product has its gross margin as well. Only by knowing and managing the mix of individual product gross margins, can management optimize the overall product set gross margin.

