
What Are Business Growth Metrics?
Business growth metrics derive from historical data, but they command attention because they predict the future.
Owners and everyone else with an interest in a profit-making company expect the business to grow over time—increasing sales, raising profits, and increasing shareholder value.
When the industry and markets are growing, a company that does not "grow" may be at risk of losing out to competition, losing customer confidence, and losing investor confidence.
Even with a static market, a business with stagnant sales and profits is a business not keeping up with inflation. As a result, senior management, shareholders, and potential investors have a keen interest in tracking business growth metrics for the company.


Business Growth Metrics Fall into Two Classes
- Single-period metrics. These measure progress towards specific short-term business objectives. Single-period measures represent either growth magnitudes or growth rates.
- Multi-period growth metrics. These represent long-term growth rates in financial performance, business volume, company size, and other business performance measures.
The multi-period growth metric cumulative average growth rate CAGR, for instance, often appears in the financial sections of company "Annual Reports." Companies often use CAGR to summarize 5- or 10-year growth rates of sales revenues and profits.
Explaining Growth Metrics in Context
Sections below further define and illustrate business growth metrics in context with related terms and concepts, emphasizing four themes:
- First, reasons that owners and analysts turn to business growth metrics to assess business performance, business health, and business prospects for the future.
- Second, seven Business Growth factors that serve as business performance indicators, and the differences between single-period and multi-period growth rates.
- Third, the meaning of exponential growth, and how to measure exponential growth rates, and how to mis-interpret exponential growth rates.
- Fourth, exponential growth modeling examples with historical sales revnue figures from Apple Computer.
Contents
- What are business growth metrics?
- Defining business growth metrics in concrete terms that measure business performance. Seven Frequently Used Growth Metrics:
- Which metrics measure single-period business growth?
- Single-period growth compared to a multi-period increase
- What is exponential growth? How do you calculate exponential growth?
- What is the cumulative average growth rate CAGR? How do you calculate CAGR?
- Lessons from tracking multi-period growth rates for Apple
Interpreting and misinterpreting CAGR multi-period metrics. - Example: What CAGR shows and what CAGR hides.
Related Topics
- Financial Metrics provides a complete introduction to metrics for analyzing cash flow and financial statements.
- Income Statement and Balance Sheet represent the primary business data sources for growth analysis.
- The Excel-based ebook Financial Metrics Pro is a comprehensive metrics handbook, teaching tutorial, and template library.
Defining Business Growth in Concrete Terms
Measuring Business Performance
Business growth metrics reveal that some firms are failing, some are barely surviving, and others are thriving with excellent prospects for the future. In most cases, everyone involved with the firm takes a keen interest in tracking business growth metrics—owners, investors, directors, officers, managers, and employees. Growth metrics derive from historical data, but they command attention because they predict the future.
In competitive industries, moreover, industry analysts and competitors also have good reason to watch growth metrics closely. Companies compete when they contend for the same customers in the same market. One firm's growth performance, therefore, is likely to impact another firm's growth performance. And, in cases where markets are expanding or shrinking, individual firm growth metrics help explain why the overall market size is changing.
Seven Ways to Ask: Is the Business Growing as it Should?
Businesspeople address such questions with single-period and multi-period growth metrics. For firms in private industry, growth analysis focuses on:
- Firstly, factors that represent earnings performance, such as profits, margins, cash flow and working capital, and earnings per share EPS.
- Secondly, factors that impact or contribute to earnings performance, such as sales revenues, operational efficiencies, competitive success rates, and market share.
Following are seven frequently used and carefully watched factors at the heart of business growth analysis. Find input data for Growth Metrics from multi-period results appearing in three financial reports:
Business Growth Metrics metrics take their primary input data from these the Income Statement, Balance Sheet, and Statement of Retained Earnings lower on the page.
Business Growth Factor 1
Growing Sales Revenues
Sales revenues, in fact, are the most popular measure of company "size." The question "How large is that company" typically brings answers such as this:
That's a $12 billion company!
Everyone understands that such figures refer to sales revenues.
Business Growth Factor 2
Growing Profits
The highest level objective for profit-making companies is, in principle, "increasing owner value." In practical terms, however, firms approach this objective by earning profits. After a successful period, owner value increases when the Board of Directors turns the period's profits into shareholder dividends and Balance Sheet retained earnings. The analyst can rightly say that the firm's future depends, above all, on its ability to earn and grow profits.
Not surprisingly, Annual Report growth metrics usually focus first on recent earnings performance and prospects for future earnings. For many, this means highlighting Income Statement "bottom-line" profits—known more formally as Net Income, Net Earnings, or Net Profit after taxes.
Other companies, however, choose instead to highlight particular profit metrics such as Operating Income or Earnings Before Interest and Taxes EBIT. These firms believe that "selective" metrics such as these paint a more authentic picture of earning performance in the firm's core line of business, than "bottom line" Net Profit.
Business Growth Factor 3
Growing EPS, Share Prices, Owners Equity
Several performance factors related to stock share ownership are also center-stage when analysts and investors ask whether the firm is meeting its highest level business objective—increasing owner value. Questions regarding ownership value focus primarily on the firm's Earnings per share EPS performance, stock share prices, and changes in the firm's Owner's Equity account.
Positive growth on these factors affirms that the company is meeting the highest level business objective, while negative growth rates on these factors show the company is not increasing owner value as it should.
Business Growth Factor 4
Growing Business Cost
Firms usually expect that costs will increase over time, in all cost categories of the firm's core line of business. "Costs" should rise when the company grows by any of the other performance measures in this section. Exceptions, of course, are costs in areas that are already known for inefficiency, which management targets for reduction.
In any case, the firm's officers and managers may give particular attention to tracking cost growth in several specific cost categories when they suspect the following:
- Gross margins are falling.
Falling gross margins are likely when gross profits are growing less than product direct costs or manufacturing overhead. - Operating efficiency is degrading.
Indicators include specific operating costs that are increasing faster than sales or operating profits. - Sales effectiveness is declining.
This decline may be indicated, for instance, when there is growth in "cost per sale" or "length of the sales cycle." Declining sales effectiveness may also be underway when there are decreases in average order size, market share, or competitive win rate.
Business Growth Factor 5
Growing Working Capital and Cash Flow
Business firms must enough maintain liquidityto meet short-term financial obligations. Business firms define liquidity with metrics that measure the firm's access to working capital or, in some cases, available cash. For that reason, officers and senior managers have a keen interest in tracking the firm's working capital and cash balances. Negative growth rates in these metrics are warnings that normal operations are at risk.
The firm may be alerted that liquidity growth is "negative" when it discovers it cannot pay for infrastructure maintenance or equipment upgrades. Negative liquidity growth can also mean the firm will soon be unable to fund marketing programs or develop new products. In extreme cases, the firm may even be unable to meet payroll. Understandably, management looks to liquidity metrics growth rates for warning signs that such problems are imminent.
The Working Capital metric derives from figures in two Balance Sheet categories:
Working capital = Current assets – Current liabilities.
- Current assets are assets of several kinds that could—in principle—transform into cash soon. Cash is a Current asset, of course, but also assets such as Inventories, Accounts Receivable, Short-Term Investments, Marketable Securities, and Prepaid Expenses.
- Current Liabilities are debts the firm must pay in the near term, usually within a year or less.
Some firms do not regard all Current Assets as being especially liquid. Firms with this view also observe the growth rates in the firm's access to cash and its ability to generate positive net cash flow.
One cash metric for this purpose is the Net Cash Flow result the firm reports each period. Net CF for the reporting period is the difference between two totals on the firm's Statement of Changes in Financial Position (or Cash Flow Statement): Sources of Cash, and Uses of Cash.
Net Cash Flow = Sources of Cash – Uses of Cash
Business Growth Factor 6
Growing Employee Headcount
Dividing the firm's annual sales revenues by the average size of the employee population provides a simple but informative measure of the firm's ability to generate revenues from its workforce. Dividing the firm's Net Profits by the same headcount figure also gives a rough but useful measure of the firm's ability to use employees productively.
Total employee headcounts are also useful for estimating and planning certain costs—costs for meeting floor space needs, for providing IT support resources, or for paying employee wages and salaries.
The interpretation of employee population growth rates can be a complicated subject, however. The optimal intercorrelations among growth rates for employee headcounts, sales revenues, and profits, for instance, change as firms move through phases of the business lifecycle. And, preferred growth rates for these factors also depend on the firm's industry, business model, cost structure, and competitive situation.
As a result, some financial officers and other senior managers spend quite a few years with a firm and its industry, before they are confident they know the optimal target size for the employee population. This understanding develops from long experience tracking growth rates for employee headcount, as well as other business performance metrics in this section.
Business Growth Factor 7
Growing Customer Base and Units Sold
These measures will usually correlate positively with sales revenues, profits, and market share. There are a few conditions, however, when units sold must grow for "profits" merely to remain constant. Such is the case when the firm is reducing prices, or with increasing "cost of sales" or overhead.
Changes in the growth rates for units sales and size of the customer base, however, are direct indicators that the company's business model is changing, or that the company's market is changing, or that the firm's success against competitors is changing.
Changes in the growth rates for units sales and size of the customer base, however, are direct indicators that the company's business model is changing, or that the company's market is changing, or that the firm's success against competitors is changing.
Single Period Growth Metrics
A company's strategic objectives may include reaching growth targets for the next year.
- The firm may set targets for growth in areas such as sales revenues, profits, profitability, working capital, cash flow, market share, unit sales, and stock prices.
- Firms may express growth targets as growth limits they should not exceed. For example, "Salaries will grow no more than 4% on average this year."
- They may also express targets for negative growth. For example," We intend to reduce expenses for office supplies by 10% this year."
Most single period targets and metrics are easy to understand when firms express them both in absolute numbers and percentages. For Example,
- "Our objective is to grow sales revenues from $1.6 million to $2 million this year, that is, growing sales revenues by 25%."
- "We intend to limit employee population growth this year to no more than 1,000 new employees beyond our current employee base of 10,000. We mean, that is, to allow no more than a 10% increase in the employee headcount.
Short-term growth targets for new business start-ups usually make sense only when the firm expresses them absolute numbers. Percentage growth figures are meaningless when starting from 0 or a near-0 base. E.g.,
- Our first-year target is $500,000 in sales.
- To reach profitability, we have to sell and ship 100,000 units in our first year.
Apple Periodic Growth 2015-2017
Example Single Period Results
| Fiscal Year |
APPLE REVENUES $ Millions |
Annual Growth |
| 2015 | $231,280 | 26.2% |
| 2016 | $214,230 | – 7.4% |
| 2017 | $229,234 | 7.0% |
| 2018 | $265,595 | 15.9% |
| 2019 | $260,174 | – 2.0% |
| 2020 | $274,515 | 5.5% |
| 2021 | (Due 28 Oct 2021) | -- |
| Fiscal Year |
APPLE NET INCOME $ Millions |
Annual Growth |
| 2015 | $53,394 | 35.1% |
| 2016 | $45,687 | –14.6% |
| 2017 | $48,351 | 6.1% |
| 2018 | $59,531 | 23.1% |
| 2019 | $55,256 | –14.6% |
| 2020 | $57,411 | 3.9% |
| 2021 | (Due 28 Oct 2021) | -- |
Exhibit 1. Single-period growth metrics for Apple Computer Revenues and Net Income, for fiscal years 2015 through 2021.
Apple Inc. enjoyed soaring exponential revenue growth from 2004 through 2014. Sales grew across this period by an average 43.1% per year. In 2014, however market dynamics clearly changed, as you can see in Exhibits 5 and 6 below. For fiscasl years 2015 through 2021, sales growth averaged 8.1% per annum, and year-to-year variability increased substantially.
As a result, corporate officers and shareholders take an especially keen interest in analyzing year-to-year growth metrics, hoping to understand better how changes in in product plans and marketing strategies—not to mention market growth, the pandemic, and supply chain health—impact the company's growth.
For the fiscal year ending September 2021, Apple expects to report Net profits of about $61 billion on Sales Revenues of about $316 billion.
(Actual figures to be announced 28 October 2021).
These figures are impressive, but Apple's Corporate officers are aware that analysts and investors know well that earnings growth since 2014 has been variable, including negtaive growth for the company in 2016 and 2019.
Annual and Growth Results
To calculate a single-period growth rate, compare the metric (e.g., Annual Revenues) for the current period with same metric from the previous period. Tables in Exhibit 1 show "Annual Growth" rates for Apple Revenues and Net Income for fiscal years 2015 through 20211.
Exhibit 1 figures lead to several conclusions about growth in this seven year period:
- Relatively high growth rates appeared in 2015, 2018, and 2021. Revenues grew in these years by 15-26% per annum.
- Revenue and profit growth were negative were negative for 2016, however, saw adverse changes for both Revenues,
- Positive revenue and profit growth returned for 2017, but at relatively low annual rates (6.7% for revenue growth and 5.8% for profit growth).
Quarterly Growth Results
| Fiscal Quarter |
APPLE REVENUES $ Millions |
Year to Year Quarter Growth |
| Q1 2019 | $84,310 | – 4.5% |
| Q2 2019 | $58,010 | – 5.1% |
| Q3 2019 | $53,804 | 1.0% |
| Q4 2019 | $64,040 | 1.8% |
| Year Total | $260,164 | – 2.0% |
| Fiscal Quarter |
APPLE REVENUES $ Millions |
Year to Year Quarter Growth |
| Q1 2020 | $91,819 | 8.9% |
| Q2 2020 | $58,313 | – 0.5% |
| Q3 2020 | $59,685 | 10.9% |
| Q4 2020 | $64,698 | 1.1% |
| Year Total | $274,515 | 5.5% |
Exhibit 2. Apple quarterly revenues for fiscal years 2020 and 2019, with growth rates for same quarter from previous year.
Exhibit 2 shows quarterly sales revenues and quarterly growth rates of for Apple sales revenues for fiscal years 2019 and 20201. The quarterly view reveals still other aspects of the Apple growth dynamics.
Apple's fiscal year runs October through September, meaning that Apple reports 3-month quarterky quartly performance in December, March, June, and September each year. Note that quarterly growth refes can can refer to either:
- Growth over the previous quarter
- Growth over the same quarter in the previous year.
Comparing each quarter's performance to the previous quarter shows that Apple's business is highly seasonal.
- The highest sales volumes occur in Q1 (October-December), including the holiday season, immediately after major product announcements in September.
- Q4 (July-September) normally brings the seoncd-highest business volume, the largest portion of which comes in September with product announcments, but also a return to school and work in the northern hemisphere.
Other useful information comes from comparing each quarter's performance to same-quarter performance in the previous year.
- Sales revenue figures for Q1 2019 were lower than revenues for Q1 2018 by -4.5%. Apple's Q1 results often signal the performance outcome for the full year. Annual sales for the full 2019 year were in fact less than 2018 annual sales.
- Sales revenues for Q1 2020 grew 8.9% above revenues for Q1 2019. For 2019, Q1 results accurately signaled positive results for the entire year.
______________________
1. Apple sales and income figures are from Apple Investor Relations website pages at https://investor.apple.com/investor-relations/default.aspx.
Single Period vs. Multi-Period Growth Metrics
New companies in their first years of business measure growth with absolute numbers for business indicators such as sales revenues, profits, or units sold. These numbers can be input into the company's business model to estimate when the company will first "break even" and when there will be enough working capital to allow further investment in hiring, developing products, acquiring assets, and other actions necessary for survival and growth.
After several years in business, however, (perhaps after an initial period of rapid expansion) it is more useful to evaluate company growth across multi-year periods. For companies established in business for several years or more, multi-year growth rates are the better indicators of healthy financial performance and prospects for the future.
- A company that grows sales revenues by $100,000 annually for ten consecutive years is showing stable sales growth figures. The same company, however, has a shrinking growth rate for sales. Will this company soon become unprofitable? That depends on management's ability to shrink cost growth even faster.
- A company that grows sales revenues by 10% per year for ten consecutive years has a positive and stable growth rate. Long-term profitability for this company requires "only" that costs grow no more than 10% per year.
What is Exponential Growth?
How Do You Calculate Exponential Growth?
When interest shifts to growth rates over multiple years, the analyst will very likely be dealing with the phenomenon of exponential growth.
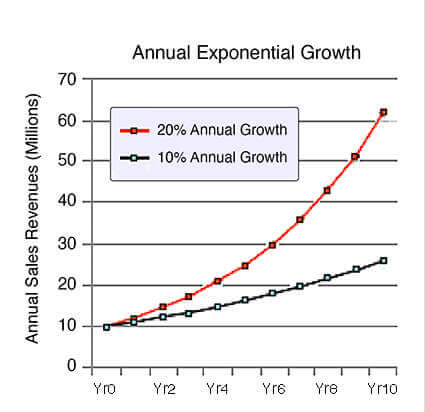
Consider, for instance, the company example above, with sales revenues growing 10% per year for ten consecutive years. With sales revenues for Year 0 at $1.0 million and a 10% annual growth rate for ten years, the result would be the lower (darker) sales revenue curve in Exhibit 2 below.

Starting with sales revenues of $1.0 million in Year 0, the lower curve reaches $2.6 million after ten years of 10% annual growth. The upper curve shows that a 20% yearly growth rate brings revenues from $1.0 million in Year 0 to $6.2 million in Year 10. The growth rates for each curve are constant from year to year but note that the revenue lines are curved. These curves show the nature of exponential growth.
The exponential growth of the same kind results, incidentally, from investing funds with interest compounding across multiple periods. $1.0 million invested at 10% per annum for ten years would result in the same curve and final total value of $2.6 million. In either case—sales revenue growth or investment growth—exponential growth follows the formula: FV = PV (1+ i ) n where:
- FV = Future Value, or Final Value.
- PV = Starting value or initial Principle deposit
- i = Annual interest rate or growth rate
- n = number of compounding or growth periods.
The number of periods, n, serves as the exponent making growth an exponential function.
Cumulative Average Growth Rate
How Do You Calculate CAGR?
The most frequently asked business growth question is something like this:
Aerofirma company reported sales revenues of $1,000,000 for Fiscal Year 2007. Ten years later, the company has sales of $2,593,743 for FY 2017. This result is a ten-year increase of more than 259%. The question is this:
What was the average annual growth rate across these years?
The section above shows how to find the final period revenue FV, given a starting revenue PV, a growth rate "i," and the number of growth periods, "n."
The question in this section, however, asks for the value of "i" across ten periods when the starting and ending revenue figures are both known. The exponential growth formula provides the answer when solved for "i" instead of FV, as shown below in Exhibit 3.
| Cumulative Average Growth Rate CAGR |
| CAGR = (FV/PV)1/n – 1.0 where CAGR = Cumulative Average Growth Rate PV = Starting (Present) Value FV = Final (Future) value n = Number of periods |
Exhibit 3. The CAGR formula answers the question: What was the average annual growth rate across "n" years?
Using the data above for FV, PV, and n, CAGR calculates as follows in Exhibit 4:
| Cumulative Average Growth Rate CAGR |
CAGR = (2,593,743/1,000,0000)1/10 – 1.0 |
Exhibit 4.Cumulative average growth rate or CAGR is the average growth rate, "i," in exponential growth. CAGR is the ratio of final value over starting value, raised to a fractional exponent, less 1.0.
In an MS Excel spreadsheet, the same CAGR formula is as follows:
= (2593743/1000000)^(1/10)-1.00
Conclusion: Aerofirma's sales revenues grew at an average rate of 10.0% per annum for the ten-year period 2007-2017.
CAGR can be computed the same way, of course, given starting and ending figures for profits, employee headcount, units sold, or any of the other business measures discussed above.
Apple Revenue Growth 2001 - 2021
Multi-Period Growth Metrics
| Apple Sales Revenues 2002 - 2020 Fiscal Year October - September | ||
| Year | Revenues $ Millions | Annual Growth |
| FY 2002 | $5,700 | 6.3% |
| FY 2003 | $6,207 | 8.9% |
| FY 2004 | $8,279 | 33.4% |
| FY 2005 | $13,931 | 68.3% |
| FY 2006 | $19,315 | 38.6% |
| FY 2007 | $24,578 | 27.2% |
| FY 2008 | $37,491 | 52.5% |
| FY 2009 | $42,905 | 14.4% |
| FY 2010 | $65,225 | 52.0% |
| FY 2011 | $108,249 | 66.0% |
| FY 2012 | $156,519 | 44.6% |
| FY 2013 | $170,910 | 9.2% |
| FY 2014 | $183,240 | 7.2% |
| FY 2015 | $231,280 | 26.2% |
| FY 2016 | $214,230 | – 7.4% |
| FY 2017 | $229,234 | 7.0% |
| FY 2018 | $265,595 | 15.9% |
| FY 2019 | $260,164 | – 2.0% |
| FY 2020 | $274,515 | 5.5% |
| FY 2021 | Due 28 Oct 21 | -- |
Exhibit 5. Apple Sales Revenues figures and annual growth rates for fiscal years 2002 - 2020.
Over the 45 years of its corporate history, business performance for Apple Computer, Inc., has seen periods of spectacular growth in revenues and profits. During the same time span, however, Apple has also seen a few periods of slow or negative growth.
The Section above, Apple Periodic Growth, shows how single-period growth metrics for Apple have been exceptionally volatile for the fiscal years 2015 - 2021. The present section and the following section take a longer term, multi-period view of Apple growth covering fiscal years 2002 through 2021.
Sales Revenue Focus for Growth
Anapysts can study Apple growth figures usefully with any of the growth performance factors from the section above—revenues, profits, or Earnings per Share (EPS), for instance. For simplicity, however, examples below focus on just one of these: Net Sales Revenues.
Those with a keen interest in predicting Apple's prospects for future growth will begin by trying to explain multi-period growth performance—and changes in multi-period performance—for significant changes in factors such as the following:
- Changes in Apple corporate management.
- Changes in competitive strategy and product strategy.
- New product introductions.
- Changes in marketing strategies.
- Advances in technologies.
- Competitors successes and failures.
- Market growth and other market dynamics.
- The impact of worldwide pandemic on technology sales.
- Supply chain problems .
- Changes in inflation rates and consumer confidence.
Apple Revenue Growth Example
Interpreting Multi-period Growth Metrics CAGR
Corporate Management and Investor Analysts alike have two reasons for carefully examining multi-period growth metrics.
- Firstly, multi-period analysis helps evaluate the impacts of management actions, such as changes to the company's business strategies, the impacts of market changes, and the consequences of competitors actions.
- Secondly, multi-period analyses of historical growth metrics serve as a basis for predicting or forecasting future business performance.
With these purposes in mind, consider the history of Apple's year-to-year growth rates for sales revenues. Exhibit 6, for instance, presents the single-year growth rates, for the period 2003-2021:


One conclusion stands out in Exhibit 6: The years 2004 - 2012 saw very high revenue growth rates (annual growth exceeding 40% per year). The years 2013 - 2021, however, showed generally lower growth rates and less predictability. Exhibit 7, below, shows that revenue growth from 2004 to 2013 was highly predictable because revenues in that period grew in close conformance with an exponential growth model.
Predicting Revenue Growth With Exponential Modeling
Exhibit 7, below, plots Apple sales revenues themselves. Note that the graph line in black, with data markers, represents sales the revenue figures from Exhibit 6. Some will notice immediately that a portion of the revenue curve looks very much like the exponential growth curves in Exhibit 2 above.
Consider, for instance, Apple sales revenues for 2003-2021, from the Exhibit 5 table above. "Revenues" clearly show strong growth for this twenty-year period: 2021 revenues of $316 billion are more than 50 times the 2003 revenues of $6.2 billion. Simply quoting the 50-fold figure, however, does not communicate a "feel" for year-to-year growth rates that Apple sustains across these years. For this, analysts will calculate the cumulative average (annual) growth rate, CAGR.


Calculating Cumulative Average Growth Rate to Model Revenue Growth
Remember that the CAGR metric is, in fact, an average (the geometric mean) of some individual growth rate figures. CAGR—like all averages—is meant to stand as the typical, or representative, value for the data set. Like all averages, CAGR says nothing about differences among individual values within the data set. Put another way, CAGR—like all financial metrics—reveals data set characteristics that might not easy to see in a simple review of the numbers, but at the same time is "blind" to other aspects of the data.
Using the Excel version of the CAGR formula, and the revenue figures for 2003 and 2013, Apple's average annual revenue growth rate calculates as:
CAGR = (170910/6207)^0.10 - 1.0
CAGR = 39.3 % (More precisely, 39.3120147%)
Exhibit 8 above plots Apple sales revenues, but note especially that Exhibit 8 also shows a mathematical exponential growth curve (solid green line), starting at $6.2 billion for 2003, and growing exponentially at 39.3120147% per year for ten years.
Because Apple's sales figures for this period approximate an accurate exponential curve, it is appropriate to use the CAGR (39.3%) to represent all year-to-year growth rates for this ten-year period. For this period, in other words, the exponential model made apple revenue growth highly predictable.
For forecasting revenues and revenue growth after 2013, however, the business analyst faces a different challenge.
What CAGR Shows and What CAGR Hides
What CAGR Hides
The cumulative average growth rate CAGR is widely used in business today, especially in Annual Reports. In these reports, firms always present multi-year performance histories, and at the same time, build a case that prospects for future growth are excellent. As a result, Investors and analysts are well-advised to keep in mind both the strengths and weaknesses of the CAGR metric. CAGR uniquely reveals some growth information, and at the same time CAGR can be blind to important aspects of growth histories.
CAGR values are based entirely on two figures from the data series: a starting value (PV) and the ending value (FV). CAGR is blind to any numbers between the first and the last. To emphasize this point, consider one final chart. Exhibit 9 shows three data series with different growth profiles but equal CAGR measures.
| Series | |||
| 1 | 2 | 3 | |
| Year 0 | 100 | 100 | 100 |
| Year 1 | 110 | 400 | 1,100 |
| Year 2 | 130 | 700 | 1,160 |
| Year 3 | 200 | 1,000 | 1,200 |
| Year 4 | 1,250 | 1,250 | 1,250 |
| CAGR | 88.0% | 88.0% | 88.0% |
Exhibit 8. Plotting data for three growth series graphed in Exhibit graph.
Data for these series could represent sales revenues, profits, units sold, or any of the business measures discussed above. Exhibit 8 covers four years of growth for the three series.
Notice that all three data series have the same starting point (PV) and same ending point (FV). However, the curves are quite different from each other.
- Series 1, Shows little growth for three years, and then "explosive" growth during the final year.
- Series 3 shows just the opposite: Massive increase in the first year, and then nearly stagnant growth for the last three years.
- Series 2 sits midway between Series 1 and Series 3, with steady growth from Years 0 to Year 4.
Nevertheless, all three series have precisely the same CAGR.
CAGR = ( 1250 / 100 )^0.25 - 1.0
CAGR = 88.03%
Differences between growth profiles are not visible in the CAGRs, but they are very clear when in the Exhibit 9 graph:

.)

Not all growth curves have anything close to the exponential profiles shown in Exhibits "2" and "7" above. Here, Series 2 and 3 depart from the exponential pattern, and are thus poorly represented by a calculated CAGR The Series 1 curve is closer to the exponential curve, but this series, too—like the Apple sales revenues in Exhibit 5—is probably better characterized by two CAGRs rather than a single CAGR for the entire curve.
Conclusion: CAGR best represents annual growth across multiple periods when the growth curve approximates an exponential function. CAGR represents yearly growth performance poorly when the overall growth curve departs substantially from the exponential curve.
For cumulative average growth rate working examples, templates, and spreadsheet implementation, please see Financial Metrics Pro.