What is Liquidity? What Are Liquidity Metrics?
Every business must learn to manage the balance between revenues and expenses, of course, but also the balance between cash inflows and outflows.
Define Liquidity
The term Liquidity refers to a firm's ability to meet near-term financial obligations. Asking if the firm has sufficient liquidity is equivalent to asking if the firm has enough cash or other liquid resources to pay its bills—obligations that are currently due or coming due soon.
Water Metaphor as a Metaphor for Funding
The term liquidity is an appropriate referency to moving cash, because In business, moving water is long-served as a a metaphor for funds and funding. Cash payments into or out of the firm are cash flow events. A series of cash flow events is a cash flow stream. A firm can pour funding into a costly project and drain the supply of Working capital. Assets that can turn quickly into cash are liquid assets. The firm has sufficient liquidity if it can pay its ongoing bills on time.


Measuring Liquidity
Liquidity metrics use figures from the firm's Balance sheet and Income statement to address one basic question:
Does the firm have enough funds available to meet near-term spending needs?
Near term usually means "the next 12 months." Deciding whether available funds are "enough," of course, requires knowledge of (1) Liquid funds available, and (2) Near-term spending needs. Each liquidity metric in following sections addresses the question by comparing these two factors, using figures from the firm's Balance sheet and Income statement.
What is the Message From Liquidity Metrics?
Poor scores on liquidity metrics may mean that the company is unable to invest in research and development that it needs in order to remain competitive. Or, very poor liquidity scores can mean that the firm must cut corners on infrastructure upkeep. Or, it may have to reduce advertising expenses and, as a result, suffer reductions in future sales. In extreme cases, the company may not even be able to meet payroll. Employees may feel the effects of liquidity problems through such actions such as pay freezes and restrictions on hiring, travel, and training.
High liquidity scores, on the other hand, mean the firm has the ability to pursue objectives beyond "survival." With ample liquidity, management can pursue goals that contribute to the stability and growth of the company.
Five Liquidity Metrics
Sections below further define and explain liquidity and liquidity metrics. This article presents the most frequently used liquidity metrics:
- Working Capital
- Current Ratio
- Quick Ratio
(Acid Test Ratio) - Cash Conversion Cycle (CCC)
- Accounts payable turnover (APT)
- Days payable outstanding (DPO).
- Cash conversion cycle (CCC).
Contents
Liquidity Metrics
Liquidity Metrics Are Financial Statement Metrics
Business Ratios for Liquidity
This article defines, explains, and calculates five popular liquidity metrics: Working Capital, Current Ratio, Quick Ratio, Accounts Payable Turnover, and Cash Conversion Cycle. These metrics are also known as Business Ratios, or Liquidity Ratios.(Although one of these, Working Capital, is not a true ratio). All derive from Balance sheet and Income statement figures.
Financial Statement Metrics (Business Ratios) in Business.
Liquidity metrics are one of six metrics families that make up the body of financial statement metrics. Analysts use these metrics to
- Evaluate the company's financial position on a given date.
- Describe the firm's financial performance for a certain period.
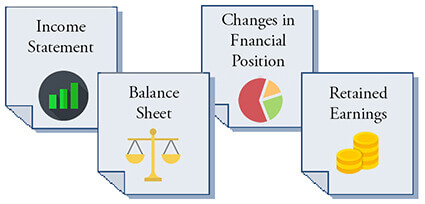
Financial statement metrics derive primarily from figures from the four primary financial accounting statements in Exhibit 1:


Most financial statement metrics are in fact ratios, for which financial statement figures serve as numerator and denominator. Dividing Balance sheet Current liabilities into Current assets, for example, produces the Current ratio metric. As a result, some businesspeople refer to all financial statement metrics as ratios. However—common usage notwithstanding—a few of these metrics are not ratios. The Working capital metric, for instance, is the difference between two Balance sheet figures, not a ratio.
Who Uses Financial Statement Metrics? For What Purpose?
Liquidity metrics and other financial statement metrics are of keen interest to several groups.
- Investors considering acquiring or trading the firm's shares of stock, or bonds.
- Company officers and senior managers, for identifying strengths and weaknesses and for setting target levels for business objectives.
- Boards of directors and shareholders for evaluating management performance.
What Are the Families of Financial Statement Metrics?
Each of the six financial statement metrics families addresses one kind of question about the company. The metrics families and the questions they address are as follows:
- Liquidity Metrics (the subject of this article)
Liquidity metrics ask: Can the firm meet immediate spending needs? - Activity and Efficiency Metrics
Activity/Efficiency metrics ask: Does the firm use resources efficiently? - Profitability Metrics
Profitability metrics ask: Is the firm earning acceptable margins? - Growth Metrics
Growth metrics ask: Are revenues, profits, and market share growing?
- Leverage Metrics
Leverage metrics ask: How do owners and creditors share risks and rewards? - Valuation Metrics
Valuation metrics ask: What are the firm's prospects for future earnings?
Sections below define, calculate, and explain frequently used liquidity metrics. Links immediately above lead to similar coverage, on other pages, for Activity, Profitability, Growth, Leverage, and Valuation metrics.
Find input data for Liquidity Metrics in two financial reports:

Liquidity Metrics Take the Near-Term View
Notice especially the focus on immediate needs and the near-term view in the input data for these metrics. Each metric compares the likely funds available to the firm, in the near term, to the firm's likely near-term spending needs.
Most businesspeople understand "Near Term" to include the next twelve months, or less. More precisely, however, accountants and financial analysts measure liquidity by defining near term as the same forward-looking time that qualifies certain assets as "Current assets" and certain liabilities as "Current liabilities."
Current Assets—The Source of Liquid Funds
Liquid assets are either cash or other Current assets that can (in principle) be turned into cash readily. Liquid assets, in other words, have the same definition as balance sheet Current Assets.
- Cash assets are by definition liquid assets—the most liquid of all assets.
- Other Current assets such as Accounts receivable, Notes receivable short-term, and Short-term investments, for instance, will probably turn into cash shortly. However, they are not yet cash. These assets are seen, therefore, as slightly less liquid than cash.
- Current assets also include the firm's Inventory assets. Inventories also will probably turn into cash—but sometimes with less certainty and requiring more time to become cash than other Current assets. The true liquidity of inventory assets depends on the nature of the firm's business.
Current Liabilities Cover the Firm's Near-Term Spending Needs
Similarly, Balance sheet Current liabilities also bring a near-term focus to these metrics. This is because Current liabilities include all known debts—liabilities—the company must pay in the near term, usually one year or less. The example Balance sheet in Exhibit 3 below lists the following Current liabilities:
- Accounts Payable
Payment due date is given by the seller's payment terms. - Notes Payable, Short-Term
These notes are essentially short-term loans. - Accrued Expenses
These may include accrued employee wages or accrued interest due. - Taxes Due
- Current Portion of Long-Term Debt
Note, however, in considering whether or not the firm has sufficient liquidity, the firm must also be prepared to cover unforeseen spending needs that can appear without advance notice. The firm may learn on short notice that it must cover, for instance:
- Providing legal defense in a court action.
- Unexpected fines or penalties.
- Restoring operability after natural disasters.
Liquidity Metric 1
Working Capital
The Working Capital liquidity metric is simply the difference between two Balance sheet figures:
Working capital = Current assets – Current liabilities
Working capital appears in currency units such as dollars, pounds, or euros. As a result, Working capital signals directly the funds amount available for near-term needs. Of the five liquidity metrics in this article, only Working capital sends this message. Consequently, those making short-term spending decisions, or planning budgets take a keen interest in the Working capital metric.
Note that Working capital is not, strictly speaking, a ratio, although business people sometimes refer to it and all other financial statement metrics as "ratios."
Calculating Working Capital.
The Working capital formula above describes the calculation. Note especially that this example uses figures from the Exhibit 3 Balance sheet at page bottom.
Balance sheet Current Assets = $9,609,000
Balance sheet Current Liabilities = $3,464,000
Working capital = Current assets – Current liabilities
= $9,609 – $3,464
= $6,145
Using the Working Capital Message
How much Working capital is sufficient? Companies address that question by projecting Current liabilities and cash inflows for the next year.
A firm has serious liquidity problems if Working capital does not cover short-term needs for such things as payroll, floor space, or loan interest due.
Any Working capital result greater than 0 signals minimally sufficient Working capital. However, the firm should also have Working capital sufficient to cover unexpected spending needs that do not appear now as Current assets. And, it may be important for the firm to have Working capital enough to undertake new initiatives in the next few months, such as marketing programs or infrastructure upgrades,
Liquidity Metric 2
Current Ratio
The Current Ratio liquidity metric is a ratio made of two Balance sheet figures:
Current ratio = Current assets / Current liabilities
The Current ratio uses the same input data as Working capital. Here, however, the metric results from dividing Current assets by Current liabilities. Because this metric is a ratio, it addresses a slightly different question: How do Current assets compare to Current liabilities? The result appears as a decimal fraction or percentage, not as an amount.
Calculating Current Ratio
The Current ratio formula above describes the calculation. Note especially that this example uses the same Balance sheet figures that served as input for the Working capital metric. From the Exhibit 3 Balance sheet example below, these are:
Balance sheet Current assets = $9,609,000
Balance sheet Current Liabilities = $3,464,000
Current ratio = Current assets / Current liabilities
= $9,609 / $3,464
= 2.7
Using the Current Ratio Message
A Current ratio value of 2.0 or greater is a generally viewed as a rule of thumb standard for good liquidity. The result 2.7, therefore signals healthy liquidity for this firm.
A Current ratio of 1.0 signals just barely sufficient liquidity to cover known short-term spending needs. A Current ratio greater than 1.0 shows the firm also was funds available to cover unexpected spending needs, or to undertake new investment initiatives.
On the other hand, a Current ratio under 1.0 would be cause for alarm. If liquidity does not improve quickly, the firm faces defaulting on some of its outstanding liabilities, or reducing operations. When the liquidity problem is especially severe, employees can expect that the firm may soon miss "making payroll."
Liquidity Metric 3
Acid Test / Quick Ratio
The Quick Ratio (Acid-Test Ratio) liquidty metric is a ratio made of two balance sheet figures.
Quick ratio = (Current assets – Inventories ) / (Current liabilities)
Quick ratio, like Current ratio, compares Current assets to Current liabilities with a ratio. This ratio, however, is nicknamed the "Acid-test ratio" because it is the most conservative of the liquidity metrics appearing here.
The Quick ratio is similar to the Current ratio, except that the Inventories figure is subtracted from Current assets in the ratio numerator. This reflects the common belief that inventories are the least liquid of Current assets.
The true liquidity of the firm's inventory assets depends somewhat on the firm's industry and the nature of its business. With this knowledge, management can judge which is the more appropriate liquidity metric for this firm—Current ratio or Quick ratio.
Calculating Quick Ratio.
Note especially that this example uses two of the same Exhibit 3 Balance sheet figures used for calculating Working capital and Current ratio. The quick ratio calculation, however, also requires the inventories figure from the same Balance sheet. These are:
Balance sheet Current Assets = $9,609,000
Balance sheet Current Liabilities = $3,464,000
And Balance sheet Inventories = $5,986,000
Quick ratio = (Current assets – Inventories ) / (Current liabilities)
= ($9,609 – $5,986) / $3,464
= 1.04
Using the Quick Ratio Message
While this company's Current ratio (2.7) might seem strong enough, the company's low acid-test ratio might be cause for concern. Analysts generally consider an acid-test ratio of about 1.1 as a minimum healthy level.
Liquidity Metric 4
Accounts Payable Turnover APT
The Accounts Payable Turnover (APT) liquidity metric counts the number of times that a firm pays off its suppliers during the accounting period. The APT calculation uses one figure from the Income statement and another from the Balance sheet:
APT = Cost of goods sold / Accounts payable
The APT result is therefore a frequency, that is, the number of "pay offs" per period.
The APT liquidity metric carries the same information as an activity-efficiency metric called "days payable outstanding" (DPO). Both metrics use the same input data, "Cost of goods sold" from the Income statement and "Accounts payable" from the Balance sheet. However:
- APT is the number of pay offs per period,
- DPO is the average number of days the company takes to pay off suppliers.
Calculating Accounts Payable Turnover (APT)
The APT definition formula above describes the calculation. Note especially that this example uses one figure from the Exhibit 3 Balance sheet and one figure from the Exhibit 2 Income statement.
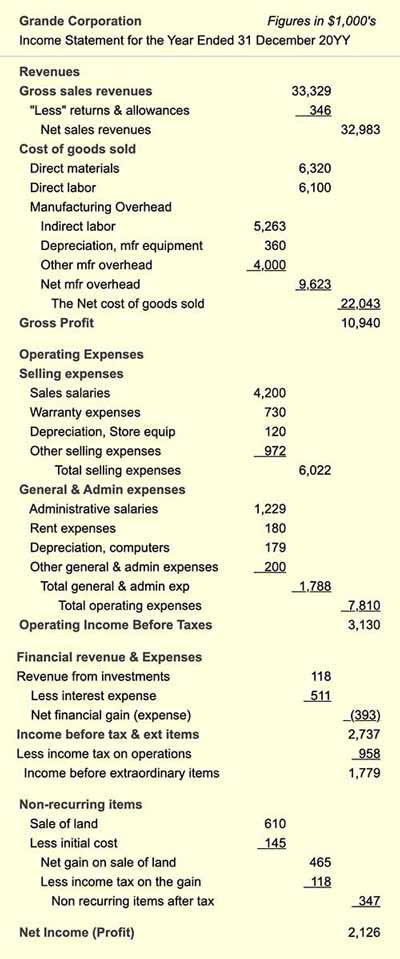
Income statement Cost of goods Sold = $22,043,000
Balance sheet Accounts Payable = $1,642,000
APT = Cost of goods sold / Accounts payable
= $22,043,000 / $1,642,000
= 13.4 pay offs/year
Using the Accounts Payable Turnover Message
The result 13.4 pay offs per year, means this firm pays off creditors about monthly, or slightly faster. That is to be expected because most creditors ask for payment within 30 days after invoicing.
A higher APT frequency could mean that the company is having trouble obtaining credit. Or, A higher APT could also mean the company is not making best use of funds, by not holding funds to earn interest for a while before pay off.
On the other hand, a trend towards a much lower frequency, for example 5-6 pay offs per year, could have other meanings. The lower APT could mean, for instance that the firm's creditors are granting longer credit terms (for example, "net 60 days"). However, the lower APT could also signal that the company is overdue paying its bills.
Comparing APT to the Activity-Efficiency Metric DPO
The Activity-Efficiency metric, Days Payable Outstanding (DPO) carries the same information as the APT metric. DPO, however, measures the average number of days the company takes to pay off outstanding bills.
Calculating DPO
Calculate DPO by dividing the number of days per period by the APT. Using the APT result above and a 365 day period, calculate DPO as follows:
DPO = Number of days per period / APT
= 365 / 13.4
= 27.2 days
Use DPO or APT?
Since APT and DPO carry the same information, some may ask which they should present in a given situation.
- The DPO activity-efficiency metric version of this information is more helpful when the focus is on using resources efficiently.
- When the focus is on the firm's liquidity, the APT frequency version is generally more helpful.
Note that some analysts prefer to calculate APT and DPO using "supplier costs" in place of Income statement Cost of goods sold (or Cost of sales, or Cost of service). This is especially appropriate when large components of "Cost of Goods sold" represent expenses other than purchases on credit from suppliers.
Liquidity Metric 5
Cash Conversion Cycle CCC
The Cash Conversion Cycle liquidity metric (CCC) addresses this question: How long does it take the company to turn its own cash investments (cash paid to suppliers) into incoming cash from customers?
CCC is considered a liquidity metric, but note that CCC is defined in terms of three activity-efficiency metrics:
DIO Days inventory outstanding.
DSO Days sales outstanding.
DPO Days payable outstanding.
CCC = DIO + DSO – DPO
The cash conversion cycle is a measure of time, expressed in days. Note that it's three components are also time measures expressed in days:
CCC qualifies in this way as a liquidity metric, but CCC is also considered a measure of management effectiveness or efficiency.Calculating CCC
The cash conversion cycle is a measure of time, expressed in days. And, its three components are also time measures expressed in days. Suppose, for this example:
DIO Days inventory outstanding = 98.7 days
DSO Days sales outstanding = 20.3 days
DPO Days payable outstanding = 27.2 days
DIO, DSO, and DPO calculations appear here, below the CCC calculation. First, however, the resulting CCC is as follows:
CCC = DIO + DSO – DPO
= 98.7 + 20.3 – 27.2
= 91.8 days
Note that days payable outstanding is subtracted from the DIO+DSO total. This assumes the company did not pay cash payment immediately for inventory purchased, but instead waited its customer DPO period before paying.
Using the Cash Conversion Cycle Metric
The CCC figure has meaning primarily when compared to other CCC figures:
- CCC can be tracked over time for the same company.
Trends towards a shorter CCC indicate improvements in management efficiency and liquidity. Trends towards a longer CCC indicate the opposite.
When the CCC is lengthening, the firm examines the CCC components trying to find underlying reasons for change. These become targets for action. - CCC for one company compared to competitors CCC.
When a firm's competitors have a superior CCC (shorter CCC), management will try to determine which of the following accounts for the difference:
- Differences in business models.
- Differences in competitive strategies.
- Different efficiencies in manufacturing, sales, or marketing.
Appendix: Calculating DIO, DSO, and DPO for the CCC metric
For the CCC example above, the three component measures derive from figures come from the sample statements below.
From the Exhibit 3 Balance sheet:
Current Assets: $9,609,000
Current Liabilities: $3,464,000
Inventories: $5,986,000
Accounts Payable: $1,642,000
Accounts Receivable: $1,832,000
From the Exhibit 2 Income statement
Net sales revenues: $32,983,000
Cost of goods Sold: $22,043,000
Days Inventory outstanding (DIO)
= Days per year / Inventory turns per year
= 365 / 3.7
= 98.7 days
Where
Inventory turns per year
= Cost of goods sold / Total inventories
= $22,043,000 / $5,986,000
= 3.7 turns / year
Days sales outstanding (DSO)
= Net sales revenues for the year / Days per year
= $32,983,000 / 365
= $90,364 sales revenues per day
Days Payable outstanding (DPO)
= Net accounts receivable / Net sales revenues per day
= $1,832,000 / $90,364
= 20.3 days
Input Data for Liquidity Metrics
Example Income Statement
Some of the data for the accounts payable turnover CCC metrics are from this sample Income statement, below, in Exhibit 2.


Input Data for Liquidity Metrics
Example Balance Sheet
Data for the liquidity metrics calculations above also come from the sample Balance sheet in Exhibit 3


