What Are Business Valuation Metrics?
Business valuation metrics reveal market consensus on a company's financial health and future earning prospects.
Valuation metrics are comprehensive measures of a company's performance, financial health and prospects for future earnings. EPS, the P/E ratio, and other metrics generally compare the market's opinion (share price) to actual reported earnings or to company book value. In this way, valuation metrics reflect the collective opinions of market analysts and investors about the company's future prospects.
Not surprisingly, these metrics are of keen interest to shareholders and investors.
Valuation Metrics: One Family of Financial Statement Metrics


Valuation Metrics belong to the larger family of financial statement metrics. These metrics use data from a company's Income statement, Balance sheet, and other financial accounting sources, to measure the strength of the company's financial performance and financial position.
This article defines, explains, and calculates four of the most frequently used valuation metrics:
- Earnings per share
- Price to earnings ratio P/E
- Book value per share
- Market to book ratio
Valuation Metrics
Valuation and Valuation Metrics
Financial Statement Metrics (Business Ratios)
Valuation metrics belong to one of six financial metrics families that analysts call Financial Statement Metrics. Financial statement metrics use date from company financial statements to measure …
- Company financial performance across a time period.
- The firm's financial position at one point in time.
These metrics derive primarily from figures in the four primary financial accounting statements in Exhibit 1:
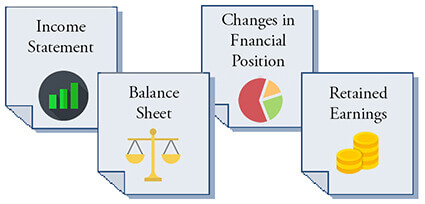
Some businesspeople refer to financial statement metrics as business ratios. This is because almost all of these metrics do in fact calculate as ratios, made of two or more financial statement figures. The four valuation metrics appearing below result from ratio calculations. However, Note especially, however, a few financial statement metrics in other families are not ratios. The Working Capital activity metric, for instance, is the difference between two Balance sheet figures, not a ratio.
What is the Purpose of Financial Statement Metrics?
Who Uses These Metrics?
Financial statement metrics are generally useful for …
- Investors considering buying or selling stock or bonds in a company.
- Shareholders and boards of directors, for evaluating management performance.
- Company officers and senior managers, for identifying strengths, weaknesses, and target levels for business objectives.
Six Families of Financial Statement Metrics (Business Ratios)
Each of the six financial statement metrics families addresses a different kind of question about the company. The six families and the general question that each addresses are as follows.
- Valuation metrics (the subject of this article).
Valuation metrics ask: What are the firm's prospects for future earnings? - Activity and efficiency metrics
Activity & Efficiency metrics ask: Does the firm use resources efficiently? - Liquidity metrics
Liquidity metrics ask: Can the firm meet immediate spending needs? - Profitability metrics
Profitability metrics ask: is the firm earning acceptable margins? - Leverage metrics
Leverage metrics ask: How do owners and creditors share risks share rewards? - Growth metrics
Growth metrics ask: Are revenues, profits, and market share growing?
Sections below define, explain, and calculate metrics in the Valuation family. Links above for other metrics families lead to similar coverage on other pages for Activity, Liquidity, Profitability, Leverage, and growth metrics.
Four Popular Valuation Metrics
Sections below define, explain, and illustrate four frequently used valuation metrics:
- Earnings per share (EPS)
- Price to earnings ratio (P/E ratio)
- Book value per share
- Market to book ratio.
Find input data for Valuation Metrics in three financial reports:
Valuation Metric 2
Price to Earnings Ratio (P/E Ratio)
Investors buy stock in a company expecting dividends and/or appreciation in share price. The extent to which they expect growth in these areas impacts the price they are willing to pay for the stock. Investor confidence in future growth is measured in the Price to Earnings ratio (or P/E ratio).
To find a firm's P/E ratio, divide the Common stock market price by earnings per common share. Note that P/E ratios can change continuously because stock prices change continuously.
Calculating the P/E Ratio
The P/E ratio definition above describes its calculation:
Price / earnings ratio =
Common stock mkt price / Earnings per common share (EPS)
Note that this P/E example uses the EPS figure results in the section immediately above (Valuation Metric 20. And, the common stock share price is the current market price.
Earnings per share of common stock EPS: $2.62
Share price, common stock: $50.00
P/E ratio = Common stock market price / (EPS)
= $50.00 / 2.62
= 19.08
Using the P/E Ratio Metric
Companies publish price to earnings values at the end of each reporting period. For some purposes, analysts consider these figures to be constant until the end of the next reporting period.
However, because stock prices vary continuously, industry analysts and individual investors may calculate the P/E ratio differently.
- The analyst comparing stock P/E ratios for different companies will probably use an average stock price for the reporting period.
- An individual investor, however, deciding whether or not to buy shares, will want to know the up to the minute P/E ratio, using the current stock price.
P/E Rule of Thumb
Analysts compare P/E ratios for individual companies to industry standards or to the P/E ratios of competing companies. A higher P/E ratio means it will take longer for the company to recover investment cost for owners (it will take longer if the P/E ratio remains at its present level, that is). A higher P/E ratio, therefore, indicates investor confidence in the future growth of earnings.
Valuation Metric 4
Market to Book Ratio
The market-to-book ratio compares the market's valuation of the company's stock to the book value per share (the subject of the previous section, Valuation metric 3). Analysts and Investors view the Market to Book ratio as a measure of investor confidence in the stock's future price.
Calculating Market to Book Ratio
The market to Book example for a company's common stock shares calculates from data and results from the previous section above:
Common stock market price per share: $50.00
Book value per common share: $14.71
Market-to-book ratio = Market value per share / Book value per share
= $50.00 / $14.71
Market to Book Rule of Thumb
Market to Book ratios greater than 1.0 indicate the market has confidence in this stock's future. A market-to-book ratio less than one is evidence that the market has low confidence in this stock's future price.
Income Statement Example
The example Income Statement in Exhibit 2 below contributes input data for some of the valuation metrics calculations above.
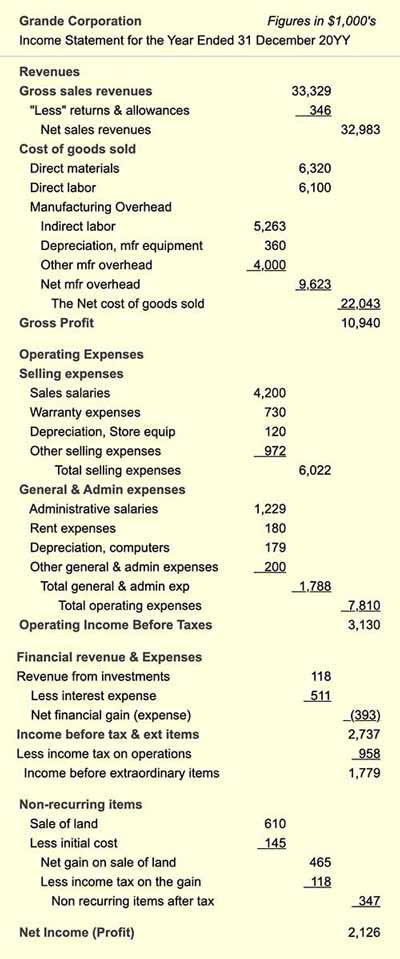
Income = Revenues – Expenses.
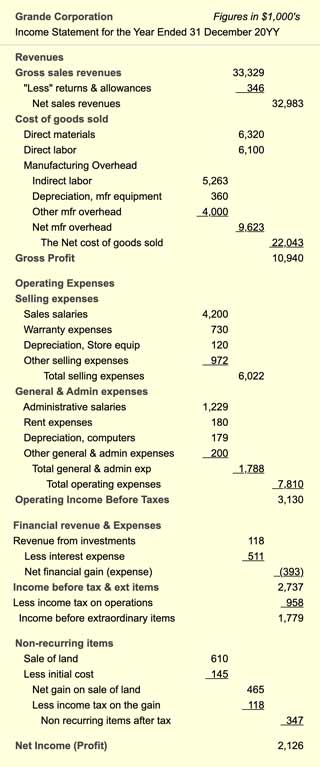
Income = Revenues – Expenses.
Balance Sheet Example
The example Balance sheet in Exhibit 3 below contributes input data for some of the valuation metrics calculations above.


Statement of Retained Earnings Example
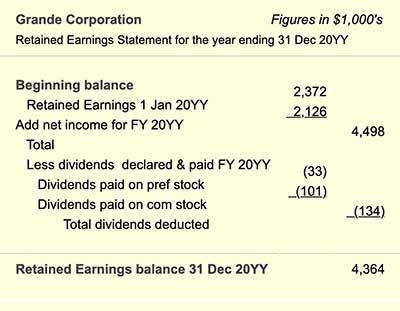
The example Statement of Retained Earnings in Exhibit 4 below contributes input data for the Earnings per Share metric above.
