What Are the Meanings of Turnover?
Turnover is all about rates—rates for earning revenues, replacing assets, replacing customers, replacing employees.
In business, the term Turnover refers to several different financial metrics that measure business efficiency and earnings performance.
Define Turnover
1. Sales Revenue Turnover is another term for Revenue Earnings for a reporting period. A company may be said, for example, to have had an annual turnover (sales revenues) of $10M last year.
2. Asset Turnover is the number of times a firm replaces assets during a year. Companies measure Turnover in this sense with Activity and Efficiency metrics such as Inventory Turns, or Accounts Turnover, or Receivables Turnover.
3. Employee Turnover refers to Employee Churn or Replacement Rate in a firm's employee population. Turnover in this sense complements the concept Employee rRetention.
4. Customer Turnover or Subscriber Turnover rates are the proportion of the customer or subscriber base that is lost and replaced during a reporting period.
When the term turnover appears by itself, the reference is almost always to the first definition above, sales revenues. For example, "This company has a $10 million turnover."


Explaining Turnover in Context
This article further defines, explains, and illustrates Turnover in context with related terms and concepts including the following:
Contents
What Does Turnover Reveal About Revenue Earnings?
One meaning of the term Turnover is simply as another name for Sales Revenues. In business, the term Sales is a short form of Sales Revenues. In other words:
Sales Revenues = Sales = Turnover
Where is Turnover on the Income Statement?
Sales Revenue (Turnover) belongs to one component of the three elements that make up the Income Statement Equation:
Income = Total Revenues - Total Expenses
Turnover (Sales Revenues) are part of the firm's Total revenues for an accounting period. Exhibits 1 and 2, below, are example income statements, showing that in one year, Grande Corporation reported revenues from 3 sources: (1) Net Sales Revenues (turnover), (2) Financial Revenues, and (3) Revenues from extraordinary items. Business people understand that any reference to Grand Corporation Turnover is a reference only to Grande's revenues from its main line of business (it's Net Sales revenues).
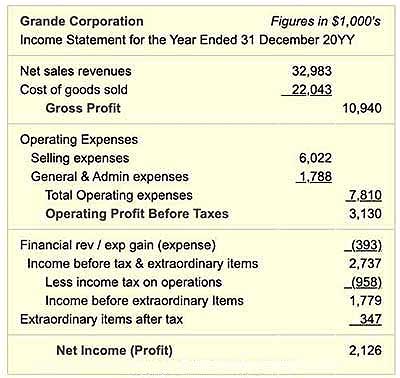

Note, incidentally, that Turnover (Sales Revenues) appear on Exhibit 1 simply as Net Sales Revenues, whereas the Income Statement with more detail in Exhibit 5 presents figures for both Gross Sales Revenues (Gross Turnover) and Net Sales Revenues (Net Turnover). It is the Net figure in all cases that enters Income statement calculations because the net figure represents revenues actually earned.
Firms in Private Industry Expect Turnover Growth
Owners of profit-making firms expect the business to grow over time—growing sales revenues, growing profits, and growing shareholder value. When an industry and its markets are growing, a firm that does not grow may be at risk of losing out to competition, losing customer confidence, and losing investor confidence.
Industry analysts, in fact, carefully track sales revenue growth metrics for public companies, from year to year. They compare turnover growth to profit growth and equity growth across the same period for other years. The primary purpose is to forecast future financial performance and market growth.
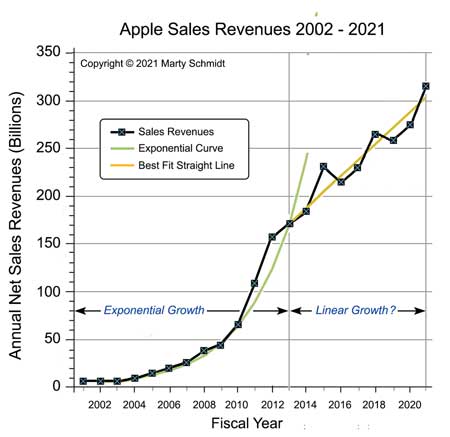
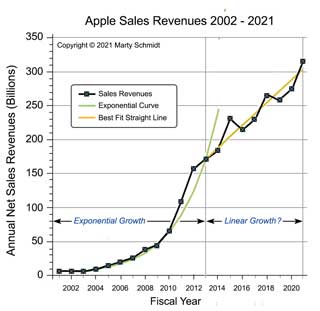
Exhibit 2, for instance, shows the sales revenue turnover growth performance of Apple, across the years 2002 - 2021. The Exhibit 2 growth curves show that Apple was remarkably successful in growing market share and revenues during this period. Potential investors take a keen interest in this kind of historical information, using it to ask: "How will Apple perform in the next few years?"
Second Turnover Meaning: Asset Turnover Rate
What Does Activity and Efficiency of Asset Usage?
Analysts view several kinds of turnover rates as measures of business efficiency, or business activity. This concept applies especially to certain categories of balance sheets asset, which should be earning returns that exceed their costs.
Merchandise inventories and manufacturing inventories, for example, are costly to acquire and expensive to handle and store. Inventory goods should quickly turn into sales revenues, but while they are sitting idle in storage they are bringing no returns—only expenses.
In most cases, the faster a firm turns îts inventory base into revenues, the more efficiently it is using inventories. The Inventory Turns metric measures the rate at which this occurs. In the same way, other Turnover metrics appearing below measure the firm's ability to earn returns from other asset classes and other resources, efficiently.
Turnover Metric 1
Inventory Turnover Per Year / Inventory Turns
Inventories "work" by getting out of the inventory warehouse and turning into sales revenues. Inventories sitting idle are not working efficiently and may not be justifying their presence on the Balance Sheet. The Inventory Turns metric, or Inventory Turn Rate, measures the efficiency of this transition.
The inventory turn rate ialso serves as a rough measure of Inventory Liquidity, that is, the ease with which the firm turns inventory into revenues. Inventories that are not turning into revenues are nonproductive assets. This metric describes Inventory turns by comparing total net sales from the income statement direclty to inventory values from the balance sheet.
Balance sheet inventory figures represent inventories at period-end, of course. When using these figures for creating the inventory turns metric, remember that the period-end figures are standing in for the typical or average inventory total for the year.
How to Calculate Inventory Turnover Rate
This inventory turns example uses three data items from the example balance sheet and income statement below:
- Total inventories at period end (Balance Sheet): $5,986,000.
- Cost of goods sold (Income Statement): $22,043,000.
- Net Sales Revenues (Income Statement): $32,983,000..
Note that analysts commonly use two different methods for calculating inventory and that the two methods can yield different Inventory Turns results.
Inventory Turns (Method 1 using Net Sales)
= Net Sales Revenues / Total Inventories
= $32,983,000 / $5,986,000
= 5.5 Inventory Turns / year
Note that some analysts calculate inventory turns using Cost of Goods Sold (CGS or COGS), or Cost of Sales in place of net sales revenues. Whereas net sales revenues represent the market value of goods, cost of goods sold for the period represents their actual cost to the company:
Inventory Turns (Method 2 using CGS)
= Cost of goods sold / Total inventories
= $22,043,000 / $5,986,000
= 3.7 turns / year
The second method using CGS will generally be lower or more conservative than Method 1 using Net Sales.
Note also, that some firms use "Average Inventory Value" in place of "Total Inventories." The latter represents the end of period Balance Sheet figure. When substantial seasonal fluctuations in inventories occur, however, the period average inventory value may be the more appropriate representation.
Using Inventory Turnover / Inventory Turns Metrics
A higher inventory turn rate is generally better than a lower inventory turn rate. Reasons for this preference include the following:
- Inventory represents an investment by the company. While the investment sits in inventory, funds used to purchase inventory cannot serve other purposes.
- Inventory may require expensive storage space and handling.
- Some kinds of inventory lose value quickly: Food, plant, and animal products may be subject to spoilage. Technology products become obsolete. Fashion products have high value only for a short season. Maintaining a high inventory turn rate for products with a short "shelf life" is critical.
On the other hand, inventory turn rates can be too high if lack of inventories interferes with the company's ability to maintain manufacturing or production schedules, provide warranty service, expand into new markets, or otherwise meet customer needs.
In conclusion:
- To track efficiency changes for a specific company, analysts compare Inventory Turns from year to year.
- Optimal inventory levels and optimal inventory turn rates represent a tradeoff between (1) inventory costs and (2) the negative business impacts of insufficient inventory.
- The difference between "good" and "poor" inventory turn metrics varies widely from industry to industry, and even between healthy companies in the same industry. An optimal inventory turn rate for one company is not necessarily an optimal rate for another.
- Inventory turn rates that fall substantially below the industry average, may signal a serious problem in production or sales.
Turnover Metric 2
Average Turnover Period / Days Sales In Inventory
/ Days Inventory Outstanding DIO
The inventory Average Turnover Period (or Days Sales in Inventory or Days Inventory Outstanding DIO) metric carries the same information as the Inventory Turns metric (above). Whereas Inventory Turns is a rate, or frequency per period, the average turnover period metric express the same information as a number of days per inventory turn.
How to Calculate Average Turnover Period
(Days Sales in Inventory, Days Inventory Outstanding).
The days sales in inventory examples here use the following data, which follow from the inventory turns results in the section immediately above:
- Inventory turns per year (based on Net Sales Revenues): 5.5
- Inventory turns per year (based on Cost of goods sold): 3.7
- Days per year: 365 (some analysts prefer 360)
Calculate Average Turnover Period by dividing the number of inventory turns per year into the number of days per year. For the same example data above:
Average Turnover Period
(Method 1, using Inventory turns based on Net sales revenues)
= Days per year / Inventory turns per year
= 365 / 5.5
= 66.4 days
The section above shows that analysts use two different approaches to calculating Inventory Turns per year. Firstly, Inventory Turns can represent Net Sales Revenues divided by Total Inventories. The second approach uses Cost of goods sold divided by Total Inventories (or Average Inventory). With the latter approach, the Average Turnover Period is usually called Days Inventory Outstanding, or DIO.
Average Turnover Period
(Method 2, using Inventory turns based on Cost of goods sold)
= Days per year / Inventory turns per year
= 365 / 3.7
= 98.7 days
DIO from Method 2 is one of the three components of the liquidity metric, Cash Conversion Cycle (CCC) For more on CCC, see the article "Liquidity Metrics" linked at the end of this section. The remaining two CCC components are other Activity and Efficiency metrics, Days Sales Outstanding (DSO) and Days Payable Outstanding (DPO). For more on these metrics, see the article "Activity & Efficiency Metrics," linked at the end of this section.
Using Average Turnover Period Days Sales in Inventory
This metric carries the same information as the Inventory Turns metric (above). Thus, the usage guidelines for Average Turnover are the same as the guidelines for Inventory Turns, above.
A minor note of caution when comparing Average Turnover Period metrics: Be sure that all values in view use the same number of days per year. The metric sometimes uses a 365-day year and sometimes a 360 day year.
For more information on Liquidity Metrics and Efficiency Metrics and example calculations, see the following articles:
Turnover Metric 4
Fixed Asset Turnover
The Fixed Asset Turnover metric compares sales revenue earnings (Net Sales Revenues from the Income statement) to the value of the company's total fixed assets (also known as Property, Plant and Equipment or, sometimes, Operating Assets), from the Balance Sheet. It measures how well the company generates revenue from assets that are not as liquid as Current Assets.
How To Calculate Fixed Asset Turnover
Data for calculating Fixed Asset Turnover appear in example financial statements below:
- Net sales revenues (from Income statement): $32,983,000.
- Fixed Assets (Total Property, Plant & Equipment, from Balance Sheet) = $9,716,000
Fixed Asset Turnover
= Net Sales Revenues / Total Fixed Assets
= $32,983,000 / $9,716,000
= 3.4 Total Fixed Asset Turns / year
For any company, fixed asset turnover will of course always be higher than total asset turnover (next section).
Using Fixed Asset Turnover
Fixed Asset Turnover usage rules of thumb are very similar to guidelines for Total Asset Turnover (following section).
- The important information for any company in Fixed Asset Turnover metrics has to do with year-to-year changes. Generally, fixed asset turnover rates should increase from year to year.
- Large investments in fixed assets are necessary in order to operate in some industries (power generation or heavy manufacturing, for instance). Operating in other industries may require very few fixed assets (consulting or other professional services, for example). In still other industries, some companies choose to acquire operational assets such as buildings, computer systems, and vehicles, while other companies in the same industry utilize the same assets through operating lease or rental contracts which leave asset ownership to other parties. For these reasons, comparing Fixed Asset Turnover ratios with industry standards or between companies should be done cautiously.
Turnover Metric 5
Total Asset Turnover
Companies acquire Assets for the purpose of generating revenues. Total Asset Turnover (this section) and the metric in the previous section (Fixed Asset Turnover) compare directly the revenue "returns" from the company's assets (sales revenues) to the book value (Balance Sheet value) of the assets. The higher the Asset Turnover Rate, the shorter the time span for assets to generate their own value in sales.
These metrics belong to the Activity / Efficiency family of financial statement metrics. They should not be confused with metrics from another family, Profitability metrics, such as Return on Total Assets or Return on Equity (those appear in this encyclopedia under Profitability metrics).
How to Calculate Total Asset Turnover
Total Asset Turnover is the ratio of Net Sales Revenues (an Income Statement entry) to Total Assets (a Balance Sheet entry). From the example financial statements below:
- Net Sales Revenues (from the Income Statement): $32,983,000.
- Total Assets (from the Balance Sheet): $22,075,000.
Total Asset Turnover
= Net Sales revenues / Total assets
= $32,983,000 / $22,075,000
= 1.49 Total Asset Turns / year
Using Total Asset Turnover
Fixed Asset Turnover usage guidelines rules of thumb are very similar to guidelines for Fixed Asset Turnover (previous section).
- The important information for any company in Total Asset Turnover metrics has to do with year to year changes. Generally, Total Asset Turnover rates should increase from year to year.
- Large investments in assets are necessary in order to operate in some industries (power generation or heavy manufacturing, for instance). Operating in other industries may require very few fixed assets (in consulting or other professional services, for example).
In still other industries, some companies choose to acquire operational assets such as buildings, computer systems, and vehicles, while other companies in the same industry utilize the same assets through operating lease or rental contracts which leave asset ownership to other parties. For these reasons, comparing total asset turnover ratios with industry standards or between companies should be done cautiously.
Turnover Metric 6
Sales Revenue Turnover Per Employee
Sales Revenue Turnover per Employee is a simple but informative measure of the firm's ability to generate sales revenues with its employee population. Firms often state publicly that "employees are our most important assets," but employee value does not appear on the Balance Sheet. Nevertheless, employees are costly resources that should produce returns. While the Balance Sheet itself does not measure employee value this way, this metric, Sales Revenue Per Employee, does provide a rough measure.
How to Calculate Sales Revenue Turnover per Employee
Sales Revenue Turnover per Employee requires only two data items. For example,
- Net Sales Revenues for year (from Income Statement Exhibit 5): $32,983,000
- Average employee headcount for the year: 500
Sales Revenue per Employee
= Net Sales Revenues for year/ Employee headcount for year
= $32,983,000 / 500
= $65,966
For companies rapidly growing or shrinking, employee headcount at year end may be quite different from the year's average value. Where employee numbers fluctuate significantly during the year, the yearly average yields a better measure of efficiency than the year-end headcount.
Growing or shrinking firms, as well as businesses that have highly seasonal sales and employee headcounts, generally prefer to evaluate Sales Revenue Turnover per Employee metrics on a quarterly or monthly basis.
Using Revenues Turnover per Employee Metrics
- A firm can be profitable only if the measure of Revenue Turnover per Employee is greater than the firm's cost per employee. Revenue turnover per employee greater than per-employee cost does not guarantee profitability, but it is a prerequisite for profitability.
- Year-to-year growth in sales revenues per employee should at least keep pace with inflation and rising costs per employee.
Third Turnover Meaning: Employee Churn Rate
Employee Population Turnover Rate
Turnover may refer to Churn or Replacement Rate in a firm's employee population. Turnover in this sense complements the concept of Employee Retention. For employers, employee turnover can bring both benefits and costs. Generally, however, high employee turnover rates are viewed as costly problems that need management attention.
When a company with 1000 employees loses 100 employees during a year, the company demonstrates an employee churn rate of 10%:
Employee Churn Rate
= Employees lost during year / Number of Employees
= 100/1000
= 0.10 or 10.0%Employee Retention Rate
= 1.0 – (Employee Churn Rate)
= 1.0 – 0.10
= 0.90 or 90.0%
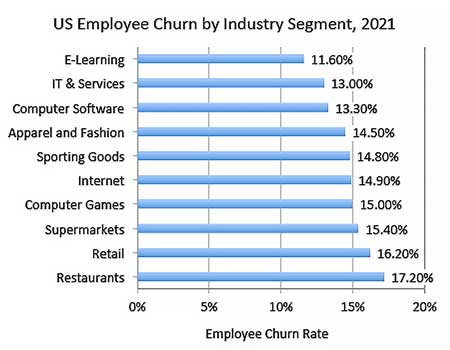
Annual Employee Churn of some kind is inevitable in all large and medium-sized businesses. Exhibit 3, for instance, shows employee churn rates in the US in 2021, by industry segment.
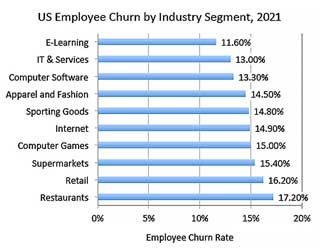
High employee turnover rates and high customer turnover rates normally represent costly problems. However, in the case of Employee churn, there are also some benefits from employee turnover.
Benefits from Employee Turnover
Employers can benefit from employee churn in several ways:
- Employee Turnover enables employers to replace less productive employees with more productive employers. Some employers "prune" the workforce periodically in this way, to maintain high productivity levels. Automobile dealerships, for instance typically hire new sales people for a probationary period, after which they replace those who do not reach sales productivity targets with other new hires.
- Turnover enables the employer to replace employees with out-of-date skills or knowledge, with entry-level hires who do have up-to-date skills and knowledge.
- Some employers create Employee Churn deliberately in order to replace more senior higher paid employees with new entry-level employees at lower cost. Government workplace rules and union rules in many places work to prevent this practice.
- When business volume is declining, employee departures (voluntary or involuntary) can enable employers to reduce employee headcounts to levels more appropriate for current needs. Both proponents and critics of this practice sometimes call this kind of action "Rightsizing.
Employer Costs from Employee Turnover
Employee turnover rates also bring employer costs which can outweigh the benefits of churn:
- Recruiting costs and new-hire training costs for replacing employees.
- Severance pay and other benefits for employees discharged in layofffs, downsizing, or redundancy actions.
- Lost productivity while new-hires acquire skills on the job and ramp up to full productivity.
- Loss of knowledge and skills that leave with departing employees.
- Disruption of workforce momentum, especially where work tasks are "team."
Why Do Employees Leave Voluntarily?
Employees leave for a variety of positive and negative reasons. They may choose to leave because of low pay, lack of compensation or recognition for high achievement employees, or availability of higher pay or better advancement opportunities elsewhere. It is well known, for instance, that successful employees in some industries advance their careers through continuous job-shopping, changing employers every 2 or 3 years or even more often. At the same time, less "marketable" employees have less opportunity to advance in this way.
Individual employees also choose to leave for a variety of personal considerations such as a burdensome commuting distance. However, knowledgeable HR managers know well that poor people management is the major reason for voluntary departures in most turnover cases:
They say "people don’t leave jobs, they leave managers," and a survey by B2B marketplace Approved Index confirms that this adage is true. In its survey of 1,374 employees in the U.K., nearly half (42%) of them have left a job because of a bad boss and almost a third of them feel their current boss is a bad manager.
— Karen Higgenbottom, "Why Employees leave," Forbes2
Fourth Turnover Meaning: Customer Churn
Turnover in Customer / Subscriber Base
Turnover may refer to Churn or Customer/Client Turnover Rate in a firm's Customer Base or Subscriber Base. Turnover in this sense complements the concept of Customer Retention. Customer Churn is always a cost to the seller—never a benefit. For businesses that rely on repeat business, a high customer churn rate represents a costly problem that calls for management attention.
A mobile phone service provider, for instance, may have 1,000,000 customers, including both prepaid-service service customers and subscribing customers. If 200,000 of these fail to renew their prepaid services or renew their subscriptions during the year, and if the same company replaces the departing customers with new customers, the company has a customer churn rate of 20.0%:
Customer Churn Rate
= Customers lost and replaced during year / Size of customer base
= 200,000 / 2,000,000
= 0.20 or 20.0%Customer Retention Rate
= 1.0 – (Customer Churn Rate)
= 1.0 – 0.20
= 0.80 or 80.0%
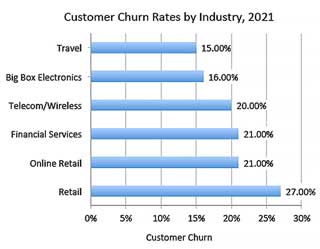
Some customer churn is unavoidable in virtually every industry and market, but especially so where firms compete intensely for market share. Exhibit 4, for instance, shows 2021 Customer Churn rates by industry, in the United States.
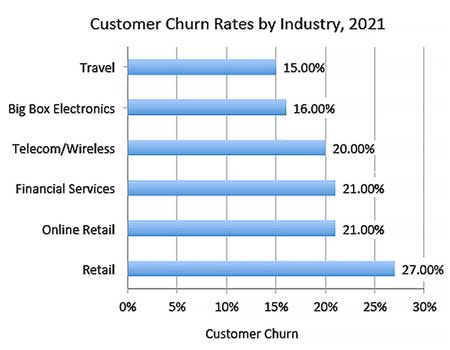
The Cost of Customer Churn
Sellers of goods or services pay close attention to their customer retention rates (repeat business rates). Businesses in some industries either succeed or fail due to their ability to win repeat business. Restaurants and mobile phone service providers are examples of this situation. For almost all businesses, the loss of repeat business and customer churn can be costly.
- In competitive industries, loss of repeat business means loss of revenues and loss of market share to competitors.
- Acquiring new customers is more costly than repeat sales to existing customers. Thus, simply replacing lost customers with the same number of new customers may maintains market share, but this comes with a high cost of sales.
Customer Retention (Combatting Churn) is primarily a Marketing Objective
In competitive industries, sellers of goods or services use a variety of well-known tactics to win repeat business can combat customer churn.
- Customer loyalty plans have proven very successful in some industries. Airline Frequent Flier plans, for instance, are among the most familiar and most effective tactics for combatting churn.
Widespread use of customer loyalty plans has spread, in the last few years, to a wide range of retail goods and services providers (e.g., grocery shops). Usually, with these plans, loyal customers rewards include discounts on future purchases or extra services. - Mobile phone service providers and other services that sell subscriptions, sometimes attempt to "lock-in" customer loyalty by selling long-term plans that come with heavy fees for early cancellation.
- Mobile phone service providers and other services that sell subscriptions also offer incentives in the form of discounts for renewing subscriptions.
- Moreover, these same providers sometimes make comparison shopping difficult, by continuously offering new and complex plans that are not easily compared with competitor's plans.
- Some restaurants, hotels, and airlines, for instance, place a very heavy marketing emphasis on the quality of their customer service and, in some cases, "customer satisfaction guarantees." It is well proven in these industries that dissatisfied customers do not become repeat customers.
Example Detailed Income Statement
Including Turnover Metrics Input Data
The example Income Statement in Exhibit 5 below provides some of the source data for Efficiency/Activity Turnover metrics illustrated above. The example below has a level of detail typical for an Annual Report.

Income = Revenues – Expenses.

Income = Revenues – Expenses.
Example Detailed Balance Sheet
Including Turnover Metrics Input Data
The detailed example Balance Sheet in Exhibit 6 below provides some source date for efficiency and activity turnover metrics illustrated above.


1. Zapp, John. "Who Has the Highest Turnover Rates?" https://www.tlnt.com/who-has-the-highest-turnover-rates-hint-its-not-retail/.
2. Higginbottom, Karen. "Bad Bosses At the Heart of Employee Turnover," Forbes,https://www.forbes.com/sites/karenhigginbottom/2015/09/08/bad-bosses-at-the-heart-of-employee-turnover/#54173ed4e632.
3. Statista, 2021. Customer Churn Rate By Industry - US. https://www.statista.com/statistics/816735/customer-churn-rate-by-industry-us/

