What is the Balance Sheet?
Balance sheet figures reveal the firm's capital and financial structures—the source of financial leverage.
Anyone with questions about a company's financial position turns first to the most recent version of the Balance Sheet or Statement of Financial Position. The balance sheet is the "go-to" source for understanding the company's debt position, financial structure, capitalization, use of leverage, asset structure, dividend history—and more.
Define Balance Sheet
The Balance Sheet (B/S) is one of 4 primary financial statements that public companies must publish after every quarter and year.
The B/S organizes account balance totals in a structure that summarizes the firm's accounts in three categories: (1) Equities (what it owns outright), (2) Liabilities (what it owes), and (3) Assets it owns and uses for operating and earning. The balance sheet structures accounts and account totals so as to represent the so-called Accounting Equation or Balance sheet equation:
Assets = Liabilities + Owners Equity
By comparing certain balance sheet totals, analysts picture the firm's financial position and financial structure—snapshots of the firm's financial strengths and weaknesses at one point in time.
The other three mandatory statements are (1) the Income statement, the (2) Statement of retained earnings, and (3) the Statement of changes in financial position. Note that some firms (IBM, e.g.) and most government organizations publish their Balance sheets under the other proper name for the balance sheet, Statement of Financial Position.


In principle, a firm could publish a new and different Balance sheet every day. In practice, they usually do so only at the end of fiscal quarters and years. The B/S heading names a date with a phrase such as this: "...at 31 December 2019."
A Balance sheet, therefore, is a snapshot of the firm's financial position at one that point in time. The B/S differs from other statements, which report activity for a specific period.
What Does the Balance Sheet Report?
For a given date, the Balance sheet shows the following for the company:
- First, total Assets. Items of value the firm owns or controls, which it uses to earn revenues.
- Second, total Liabilities. What the firm owes.
- Third, total Owners Equities. What the firm owns outright.
More accurately, the Balance sheet shows end-of-period balances in the firm's Assets, Liabilities, and Owners Equity accounts. However, its name includes "Balance" for another reason. The three main B/S sections represent the accounting equation:
Assets = Liabilities + Owners Equity
The term "balance" applies because the sum of the firm's assets must equal (balance) the sum of its liabilities and owner’s equities. This balance holds, always, whether the firm's financial position is excellent or terrible. Double entry principles in accrual accounting ensure that every change to the total on one side brings an equal, offsetting change on the other side.
Where is "Financial Position" on the Balance Sheet?
Analysts evaluate a firm's financial position not by the size of the Assets total, or its balancing counterparts, but rather by comparing numbers on the sheet.
- The firm's liquidity, for instance, is given by metrics that compare Balance sheet figures, such as Current ratio and Working capital.
- The firm's capital and financial structures, for example, are built as ratios of Balance sheet figures for Owners Equities and Liabilities. These structures define the firm's Capitalization and level of leverage.
- Other metrics compare Balance sheet and Income statement figures to measure the firm's stock valuation, prospects for growth, and the ability to use assets efficiently.
Explaining the Balance Sheet in Context
The Sections below further define and illustrate the Balance sheet in context with related terms and concepts, focusing on five themes:
- Defining Balance Sheet structure and contents.
- Explaining how firms prepare the Balance Sheet at accounting cycle end, during the trial balance period, and its role n financial reporting.
- How Balance Sheet categories create the firm's asset structure, capital structure, financial structure, and level of leverage.
- How principles of accrual accounting and double-entry bookkeeping ensure that the Balance Sheet always balances.
- Where the Balance Sheet provides data for calculating business performance and financial position metrics.
Contents
The Balance Sheet
Balance Sheet Structure
Simple Example
The Balance sheet essentially reports end-of-period balances in a firm's Assets, Liabilities, and Owners Equity accounts. The Balance sheet organizes information to represent a detailed version of the accounting equation:
Assets = Liabilities + Owners equity
The level of detail in a published B/S depends on the intended and audience its purpose for using Balance sheet information.
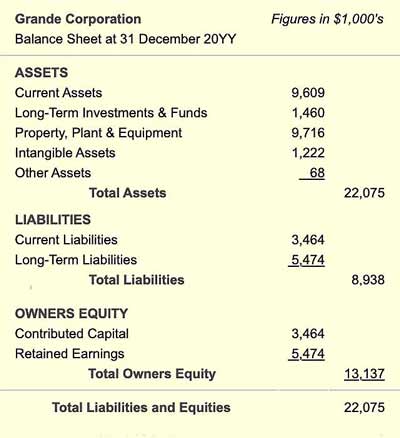
- Exhibit 1, below, is a high-level Balance sheet with minimal detail.
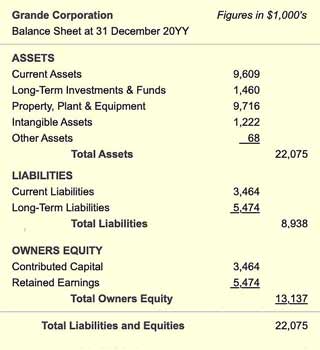
- Exhibit 2, below, is the same Balance sheet with more detail.
Annual Report versions of the Balance Sheet usually carry a level of detail no less than Exhibit 1 and no more than Exhibit 2.


The entire sheet sometimes appears in a horizontal layout, with an "Assets" Page on the left, and a "Liabilities and Equities" page on the right. That layout explains why people refer to "sides" of the Balance sheet. Alternatively, the B/S appears in a vertical arrangement, as in Exhibits 1 and 2. In such cases, people still refer to the "Assets side" or the "Liabilities and Equities side" of the sheet.
Where Do Owners Publish the Balance Sheet?
Shareholders Investors Find the B/A in the Annual Report
Companies usually publish a Balance sheet just after the end of every fiscal quarter and year. Note that firms often release different B/S versions, with varying levels of detail.
For shareholders and the general public, the most accessible version is the one in the firm's Annual Report to Shareholders. Public companies publish and send this report to shareholders before their annual meeting to elect directors. Shareholders typically receive printed copies by mail, but these reports are also available to everyone on the firm's internet site. Annual Reports and financial statements usually appear under site headings such as Investor Relations, or Investor Services.
For the annual report, the firm is legally responsible for publishing a Balance sheet and other statements that serve two purposes:
- Firstly, to enable shareholders to make informed decisions when electing directors.
- Secondly, to enable shareholders and investors to evaluate the firm's recent financial performance and prospects for future growth. This information is crucial for making informed decisions on holding, buying, or selling stock shares. Firms also publish financial statements that serve different audiences and other purposes as ell.
How Debits and Credits Maintain the Balance
Illustrating Double Entry Accounting
Most business people readily understand the structure and mathematics of the Income statement. Nevertheless, many have trouble understanding the Balance sheet.
- One reason for this, probably, is that the Income statement starts with Revenues, and then subtracts expenses to reach bottom line Net profit.
- However, understanding Balance sheet mathematics requires familiarity with basic principles of double-entry accounting.
Those familiar with accounting systems may also note that most of the Balance sheet line items are also the names of accounts from the firm's Chart of Accounts. These are the "Assets," "Liabilities" and "Equities" category accounts.
Start with the Basic Equations
Both the Income statement and the Balance sheet start with simple equations. The basic Income Statement equation is this:
Income = Revenues – Expenses
The Balance sheet starts with an equally simple equation, the so-called Accounting Equation Balance sheet equation:
Assets = Liabilities + Owners Equity
Regarding the Balance sheet and double-entry accounting, some businesspeople hold that the Accounting Equation above must also include this component:
Debits = Credits
In everyday usage, people think of debits to a checking account, for example, simply as reductions. And, they think of credits as additions. Banks use these terms on account holder statements.
Debit and Credit Impacts Depend on Account Category
Debits and credits, however, have different results on different sides of the Balance sheet.
- First, consider the "Liabilities + Owners Equity" side of the B/S. To accountants, the bank's usage is technically correct. However, this usage is accurate only because banks regard an account holder as a Liability account. In double entry accounting:
- A Credit increases the balance in a Liability or Equity account.
- A Debit decreases the balance in a Liability or Equity account.
- Second, consider the "Assets" side of the Balance sheet. Here, the rules for debits and credits reverse:
- A Credit decreases the balance in an Assets account.
- A Debit increases the balance in an Assets account.
In double-entry accounting, every financial event must impact at least two accounts. Whether each impact is a "debit" or a "credit" depends on the account categories involved. The double-entry approach ensures that the Balance sheet always balances.
Example: Debits and Credits Maintain the Balance
Suppose the firm acquires assets for $1,000. An asset account (perhaps under Current Assets) increases $1,000. This increase could, for instance, occur in an "Inventories" account. The increase results from a "debit" or "DR" because the Inventories account is an Asset category account.
The sheet is now temporarily out of balance until a credit of the same size appears in another account. This credit (CR) could be either:
- A reduction in another account on the Assets side of the sheet. This reduction could be, for instance, a credit to a cash account also under Current assets.
- An increase on the "other side" of the Balance sheet in a "Liabilities" or "Equities" account. This increase could be, for instance, a credit of $1,000 to a "Long-term liabilities" account. This kind of transaction will follow if the firm borrows the purchase funds.
In this way, total Balance sheet Assets always equal total Liabilities and Equities, while Total debits always equal Total credits.
Balance Sheet Structure and Contents
Detailed Example
Exhibit 2 below shows another version of Balance sheet from Exhibit 1, this time with more detail. Definitions for the major categories and line items appear below the example.


Balance Sheet Categories
Categories Within Assets, Liabilities, and Equities
On the Assets "side" of the Balance sheet, significant categories may include the following:
Current Assets
These are assets that, in principle, the firm could turn into cash in the near term. "Near term" generally means one year or less. Current assets include, of course, Cash on hand, but also Short-term investments, Accounts receivable, Inventories, and Prepaid expenses.
Long-Term Investments and Funds
These are assets that do not convert to cash quickly. These may include stocks and bonds from other companies or other long-term investments.
Property, Plant & Equipment
These are the company's significant physical assets, such as buildings, factory machines, vehicles, and computer systems. Firms usually charge the cost of these assets against income as depreciation expense across the life of the asset. Note that each year of the asset's depreciable life, the depreciation expense contributes to "Accumulated depreciation." As a result, total assets "book value" decreases.
Intangible Assets
Intangible assets contrast with physical assets. Intangibles cannot be seen or touched, but they are still assets because:
- Firms acquire intangible assets at a cost.
- The firm has exclusive rights to them.
- They contribute to the firm's ability to earn.
Examples include copyrights and patents, trademarks, brand image, and goodwill.
Liabilities and Owners Equities Categories
On the Liabilities and Owners Equities side, the significant categories usually include:
Current Liabilities
These are obligations the firm must meet in the near term (one year or less). They may include such things as Accounts payable, the due portion of long-term debt, and short-term warranty obligations.
Long-Term Liabilities
These are obligations due for a period longer than one year. Long-term liabilities may include bank notes, bonds, or long-term financing arrangements for purchases.
Contributed Capital
Contributed capital is one of the two main categories under Owner's Equity (the other is "Retained earnings"). Contributed capital is what stockholders invest by purchasing of stock directly from the company. Contributed capital, in turn, has two main components:
- Stated Capital, which represents the stated value, or par value of the shares.
- Additional Paid-in Capital, which represents money paid to the company above the par value.
Retained Earnings
After a successful period, a company can (at the discretion of its board of directors) pay some of its income to shareholders, as dividends, and keep the remainder as Retained earnings. The firm’s cumulative Retained earnings appear on the Balance Sheet under Owner’s Equity
Balance Sheet Contributions to Financial Metrics
Balance Sheet Impact on Business Ratios
The Balance sheet is a primary data source for financial metrics and financial statement ratios. Financial statement metrics generally fall into six families. The members of each address questions like these:
- What are the firm's future earnings prospects?
Valuation metrics such as the "price to earnings ratio" deal with such questions. - Can the firm meet its short-term financial needs?
Liquidity metrics such as current ratio address such questions. - Is the firm using its resources efficiently?
Activity metrics such as inventory turns address such questions. - Do the firm's funds come primarily from owners or creditors?
Leverage metrics, such as debt to asset ratio provide answers - Is the company profitable? Is it making good use of its assets? Profitability metrics such as operating margin address such questions.
- How does the company's growth over the last five years compare to similar companies? To industry averages? Growth such as the cumulative average growth rate address such questions.
For more on financial metrics families, see …
Who Uses Financial Statement Metrics?
The primary users of financial statement metrics include:
- Investors considering holding, buying, or selling stock shares or bonds.
- Managers, for identifying strengths, weaknesses, and target levels for business objectives.
- Shareholders and Boards of directors, for evaluating management performance.
Balance Sheet Reveals Three Structures
Asset Structure, Financial Structure, Capital Structure
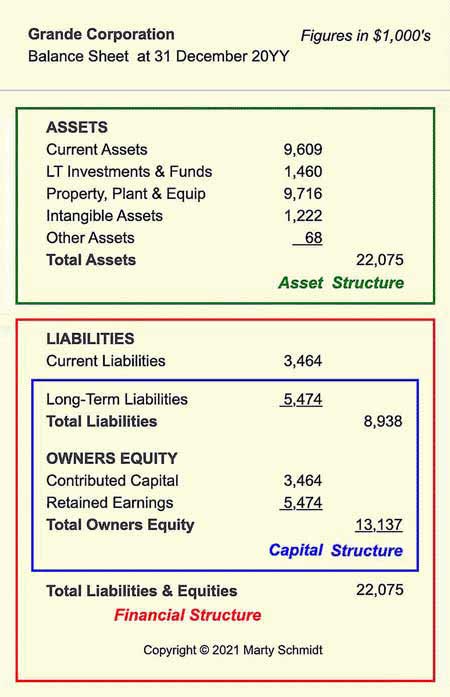
A firm's Balance sheet defines three structures, which in turn, determine how the firm uses assets, liabilities, and equities to earn revenues and profits. Exhibit 2, below, shows how these structures refer to groups of Balance sheet items. Red, Green, and Blue borders in Exhibit 3 show which Balance sheet categories make up each structure:
- First, Financial structure (red border).
- Second, Asset structure (green border).
- Third, Capital structure, or Capitalization, (blue border).
Exhibit 3 shows how these structures are defined as groups of accounts on the a firm's Balance sheet.


Businesspeople evaluating a specific firm's strengths and weakesses, focus on balance sheet structures to do so. Structure analysis for this purpose is a matter of comparing the relative magnitudes of items within each structure.
- Financial and capital structures show how investor owners share risks and rewards of company performance. Therefore, these structures describe leverage.
- Asset structure shows how the firm chooses to maximize return on assets ROA.
For more on the role of structures in sharing risks and rewards, see these articles:

